Figure 5.

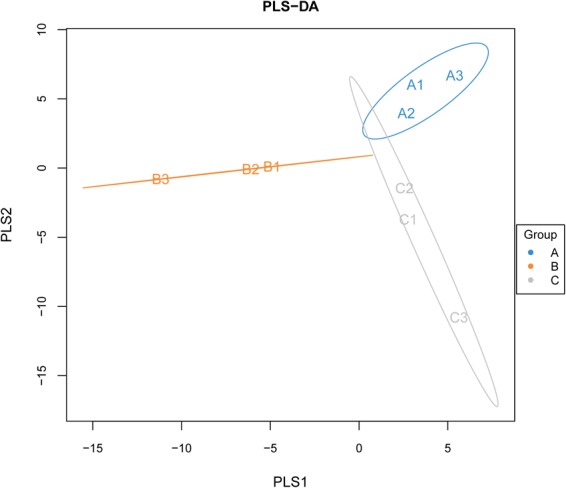
PLS-DA discriminant model from A1, A2, A3, B1, B2, B3, C1, C2, and C3 samples. VIP coefficients of A1, A2, A3, C1, C2, and C3 were greater than 1; however, those of B1, B2, and B3 were less than 1.

PLS-DA discriminant model from A1, A2, A3, B1, B2, B3, C1, C2, and C3 samples. VIP coefficients of A1, A2, A3, C1, C2, and C3 were greater than 1; however, those of B1, B2, and B3 were less than 1.