
Figure 5.
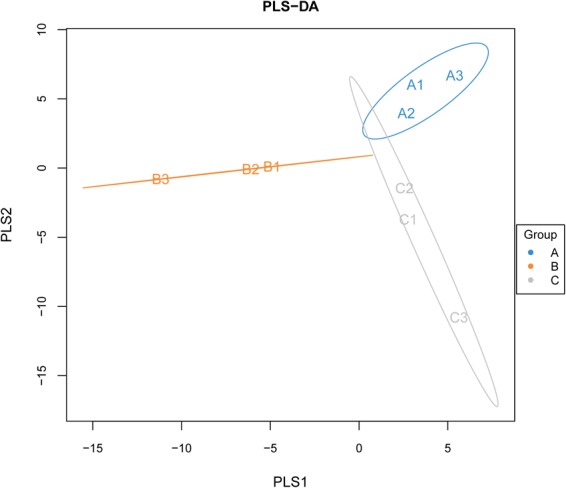
PLS-DA discriminant model from A1, A2, A3, B1, B2, B3, C1, C2, and C3 samples. VIP coefficients of A1, A2, A3, C1, C2, and C3 were greater than 1; however, those of B1, B2, and B3 were less than 1.
Official websites use .gov
A
.gov website belongs to an official
government organization in the United States.
Secure .gov websites use HTTPS
A lock (
) or https:// means you've safely
connected to the .gov website. Share sensitive
information only on official, secure websites.
PLS-DA discriminant model from A1, A2, A3, B1, B2, B3, C1, C2, and C3 samples. VIP coefficients of A1, A2, A3, C1, C2, and C3 were greater than 1; however, those of B1, B2, and B3 were less than 1.