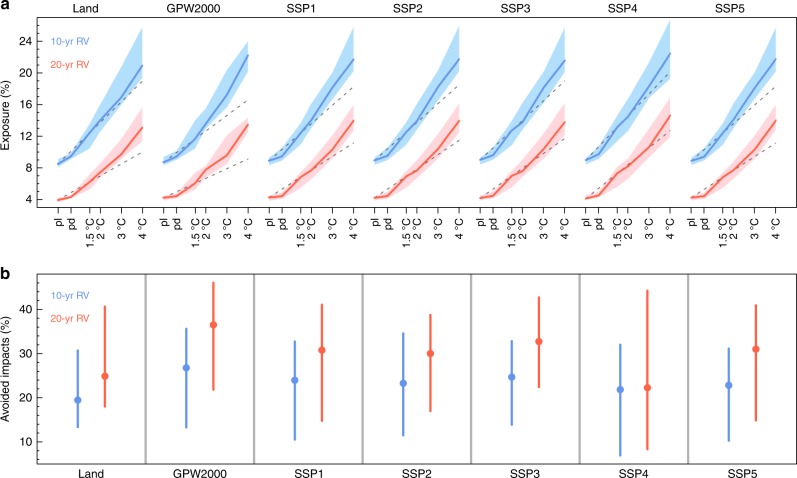
Fig. 4.
Areal and population exposures to dangerous RX5day events over the GM region. a Fraction of land area and population experiencing RX5day events that exceed baseline 10- and 20-year return values (RVs) at the preindustrial (pI, 1861–1890, 0 °C), present-day (pd, 1986–2005), 1.5, and 2–4 °C warming levels, over the GM region. Population in 2000 (GPW2000) and under SSPs 1–5 in 2100 are used to estimate population exposure. The multimodel medians (solid lines) and interquartile ranges (shadings) are shown. The abscissa in (a) is proportional to the warming magnitudes, where a warming of 0.61 °C is set for 1986–2005 (ref. 45). The dashed gray lines denote the linear extrapolation from the preindustrial (0 °C) and 1.5 °C warming levels. b Areal and population exposures reduced by the 1.5 warming compared to 2 °C warming for RX5day events that exceed the baseline 10- and 20-year return values (see Methods). Circles and bars denote multimodel medians and interquartile ranges, respectively. Where more (less) than 2/3 of the models indicate reduced exposure by the 0.5 °C less warming are indicated by solid (open) circles

