Fig. 2.
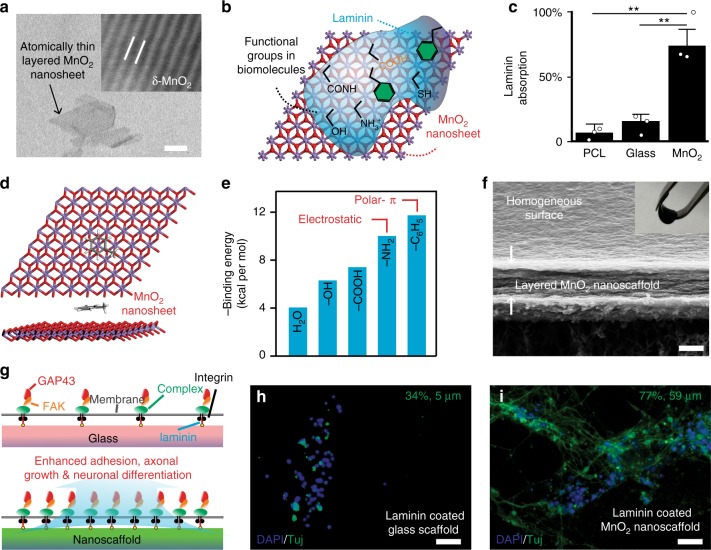
Enhanced stem cell differentiation using biodegradable MnO2 hybrid nanoscaffolds. a Representative TEM (Transmission Electron Microscopy) of atomic-thin layered MnO2 nanosheets. Inset: HR (High Resolution) TEM image (image size: 18 Å by 14 Å). b A schematic diagram describing the intermolecular binding between MnO2 nanosheets and selected functional groups that are commonly existent in ECM proteins and biomolecules. c A significantly upregulated ECM protein (laminin) binding towards 2D MnO2 nanosheet, compared to control substrate [etched glass and polycaprolactone (PCL) substrates). These upregulated laminin binding was studied by a BCA protein assay. Data are mean ± s.d. n = 3, **P < 0.01 by one-way ANOVA (Analysis of variance) with Tukey post-hoc test. d, e, By modeling small molecule-nanosheet interactions (d), we summarized differential binding affinities of MnO2 nanosheets towards of a library of functional groups (e). These simulation results aligned well with experimentally observed enhanced laminin binding, as laminin structures are rich in both amino and aromatic moieties. Exemplary molecule in d: toluene. Carbon and hydrogen atoms are colored in black and gray, respectively. f A representative SEM image showing the layered structure and homogeneous surface of MnO2 hybrid nanoscaffolds fabricated using the vacuum filtration technique. Inset photograph: a free-standing MnO2 hybrid nanoscaffold fabricated by vacuum filtration and manipulated by a tweezer. g A schematic diagram illustrating the proposed mechanism for the enhanced neuronal differentiation on MnO2 hybrid nanoscaffolds. Red color indicates GAP43; Orange indicates FAK; Green indicates integrin complex. h, i Representative immunostaining data supporting the significantly enhanced neuronal differentiation and neurite outgrowth of iPSC-NSCs on MnO2 hybrid nanoscaffolds (i) compared to control substrates (h). Cell nuclei are in blue and TuJ1 is pseudocolored in green. Average percentages of neuron and neurite lengths were measured using NeuronJ software (h: n = 9; i: n = 12) and labeled on the top right of each image. Scale bars: a 25 nm; f 500 nm; h, i 100 μm

