
Figure 1.
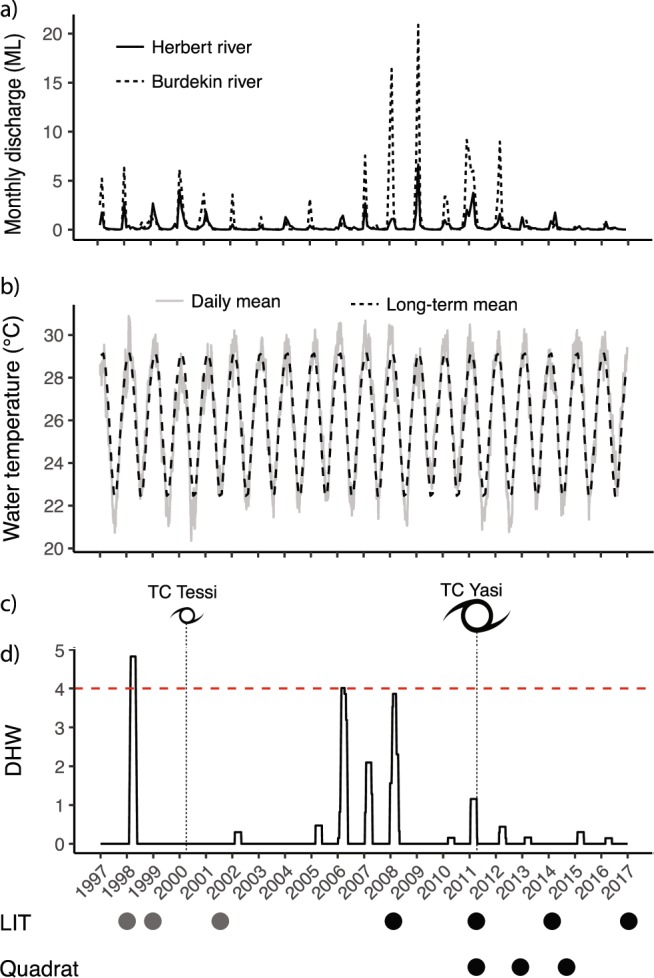
Disturbance history of fringing reefs of the Palm Islands, central Great Barrier Reef, between 1997 and 2017, in relation to sampling time points (LIT = Line Intercept Transect; grey circles represent historical data46, black circles represent new data collected for the present study). (a) Monthly discharge of Herbert (solid line) and Burdekin (dashed line) rivers in megalitres (Source: Queensland Government Water Monitoring Portal, https://water-monitoring.information.qld.gov.au/host.htm); (b) daily mean (solid grey line) and long-term monthly mean (dashed line) water temperature (in °C) at Orpheus Island (Source: Australian Institute of Marine Science Historical Data Tool, http://data.aims.gov.au/aimsrtds/datatool.xhtml); (c) timing of two cyclones affecting the Palm Islands between 1997 and 2017 (Cat. 2 TC Tessi in Apr 2000, http://www.bom.gov.au/cyclone/history/tessi.shtml; Cat. 5 TC Yasi in Feb 2011, http://www.bom.gov.au/cyclone/history/yasi.shtml); (d) cumulative heat stress on reefs of Orpheus and Pelorus Islands (in Degree Heating Weeks, DHW) calculated from temperature data presented in panel C, following NOAA’s protocol80; dashed red line indicates the theoretical bleaching threshold of 4 DHW.