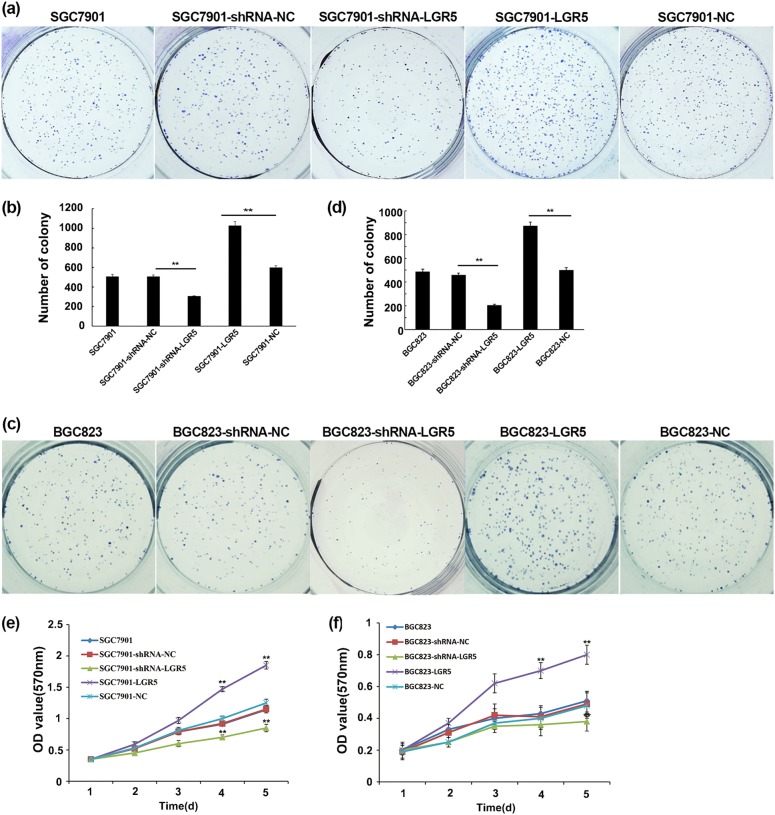
Fig. 2. Overexpression and knockdown of LGR5 have opposite effects on cell proliferation.
a, c Gastric adenocarcinoma cells were plated 24 h after transfection with 1.5 × 10³ cells/well in six-well plates for 14 days then tested for their ability of clonogenicity as described in Methods. The colonies (≥50 cells) were numbered. Representative images of colonies in plates stained with Giemsa. Images were taken using a Nikon 90i with a DXM 1200C camera. b, d Data are presented as values of mean ± SD from three independent measurements and the asterisk indicates statistical significance compared with the control (untransfected) parental cells. P-values were calculated with Student’s t test. **P < 0.01. e, f Cell viability was assessed by MTT assay. Cell growth curves were determined by absorbance at 570 nm. Experiments were done in triplicate and data from three independent experiments are shown. **P < 0.01: error bars show SEM

