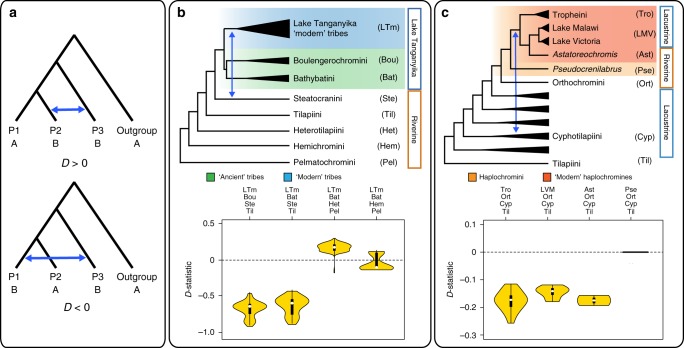
Fig. 3.
Hybridization in the Lake Tanganyika species flock. a Schematic representation of Patterson’s D test. Blue arrows represent gene flow between distantly related lineages, either P2–P3 (ABBA excess; D > 0) or P1–P3 (BABA excess; D < 0). b Proposed scenario for the hybridization between Steatocranini and 'modern' tribes of Lake Tanganyika. c Hybridization between Cyphotilapiini and haplochromines. Violin plots show the distributions of Patterson’s D-statistics from individual-based permutations using different taxa combinations, as labeled in the phylogeny. Taxa configurations follow the concatenated maximum likelihood tree (Supplementary Fig. 1) because it allows testing the hypothesized hybridization events

