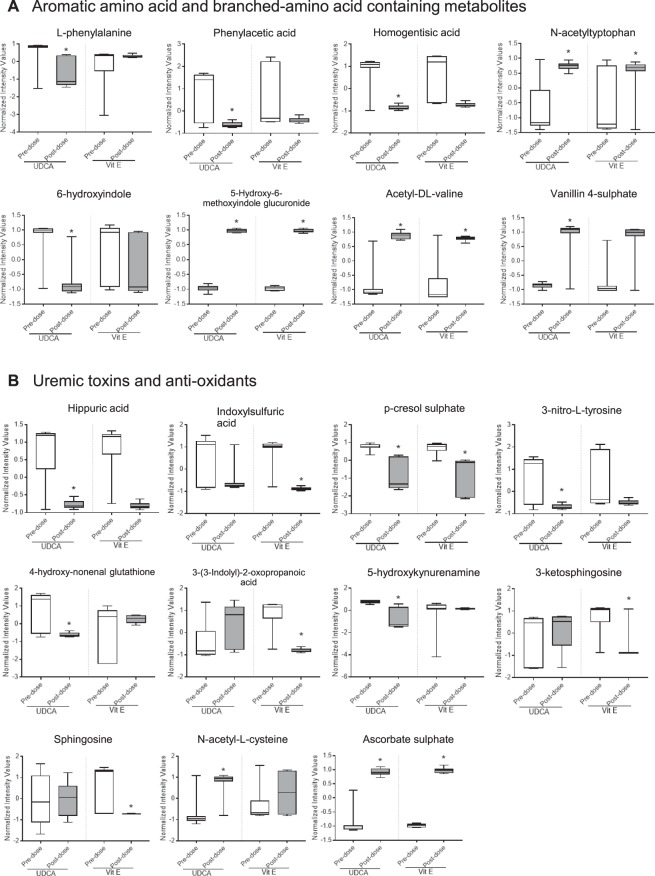
Figure 4.
Relative intensity of identified metabolites. Relative intensities of each identified metabolite in the urine and plasma are shown with boxplots. (A) Metabolites containing aromatic amino acids or branched amino acids (L-phenylalanine, phenylacetic acid, homogentisic acid, N-acetyltryptophan, 6-hydroxyindole, 5-hydroxy-6-methoxyindole glucuronide, acetyl-DL-valine, and vanillic acid sulphate). (B) Metabolites known to be toxic [hippuric acid, indoxyl sulphuric acid, p-cresol sulphate, 3-nitro-L-tyrosine, 4-hydroxynonenal glutathione, 3-(3-indolyl)-2-oxopropanoic acid, 5-hydroxykynurenamine, 3-ketosphingosine, and sphingosine] or antioxidants (N-acetyl-L-cysteine and ascorbate sulphate). The boxplots show 5% and 95% confidence intervals. A paired t-test was used for statistical evaluation. *FDR-adjusted P-value < 0.05 between pre-dose and week 8.

