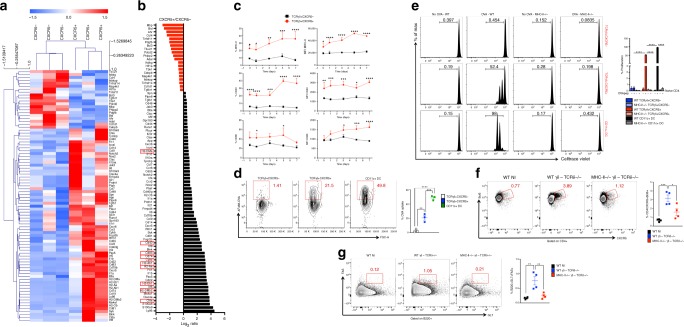
Fig. 6.
TCRγδ+CXCR5+ cells function as antigen-presenting cells. a Transcriptional signatures of TCRγδ+CXCR5− and TCRγδ+CXCR5+ cells sorted from dLN of WT mice 7 days after CFA immunization. Only statistically different (p < 0.05) mRNA levels are shown (n = pooled cells from 5 mice/column). b Log2 ratio (p < 0.05) of mRNA levels from TCRγδ+CXCR5− and TCRγδ+CXCR5+ cells. Red squares indicate mRNAs related to antigen presentation function. c Frequency and median fluorescence intensity (MFI) of MHC-II, CD40, and CD86 expression on TCRγδ+CXCR5− and TCRγδ+CXCR5+ cells from dLN of WT mice before immunization (day 0) and 1, 3, 5, and 7 days after CFA immunization (n = 5 mice/group). d Soluble ovalbumin (OVA) coupled to Alexa Fluor 488 (OVA-Alexa Fluor 488) endocytosed by TCRγδ+CXCR5−, TCRγδ+CXCR5+ and CD11c+ dendritic cells after 3 h of culture at 37 °C (n = pooled cells from 12 mice). e Proliferation of CellTrace Violet-stained naïve CD4 T cells from OT-II-Foxp3-GFP mice co-cultured (3 days at 37 °C) with or without OVA323–339-loaded TCRγδ+CXCR5−, TCRγδ+CXCR5+ or CD11c+ dendritic cells (DC) from dLN of WT or MHC-II−/− mice 4 days after CFA immunization (n = pooled cells from 10 mice/experiment). f, g In vivo Tfh cell induction (f) and germinal center formation (g) in dLNs of TCRδ−/− mice transferred intravenously with 5 × 10⁵ γδ T cells from either WT or MHC-II−/− mice. Three days after transfer, recipient mice were immunized or not (WT NI) with CFA and 7 days thereafter sacrificed for flow cytometric analysis (n = 4 mice/group, where γδ T cells are sorted from a pool of 10 mice/group). These data are representative of two independent experiments (a–e). Data are shown as mean + SEM. Pearson's correlation was used for hierarchical clustering in a. Student’s t-test (a–c) or one-way ANOVA (d–g) were used. *p < 0.05, **p < 0.01, ***p < 0.001, ****p < 0.0001

