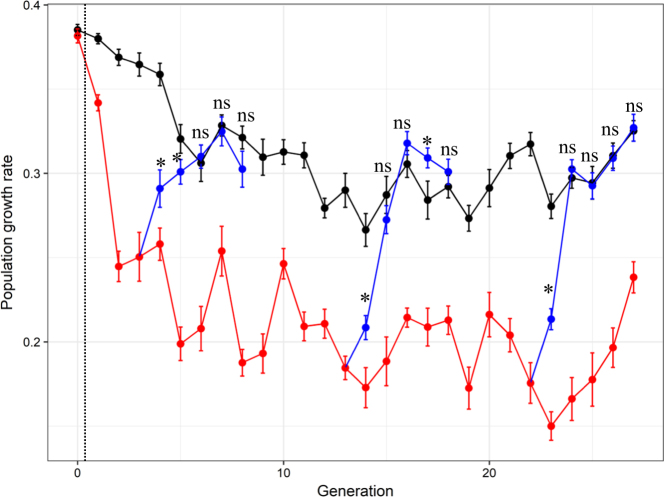
Fig. 3.
Aphid population growth rate (mean ± SE) across generations in the experimental evolution with predators (in red), without predators (in black) and in the branch lines for which predators were removed after generations 3, 13, and 22 (blue lines). “*” and “NS” denote significance (P < 0.05, or P > 0.05, respectively) of differences between the control without predator (black dots) and the treatment in which predators were removed (blue dots) at a given generation. The vertical black dashed line indicates the time of initial predator introduction in treatment lines

