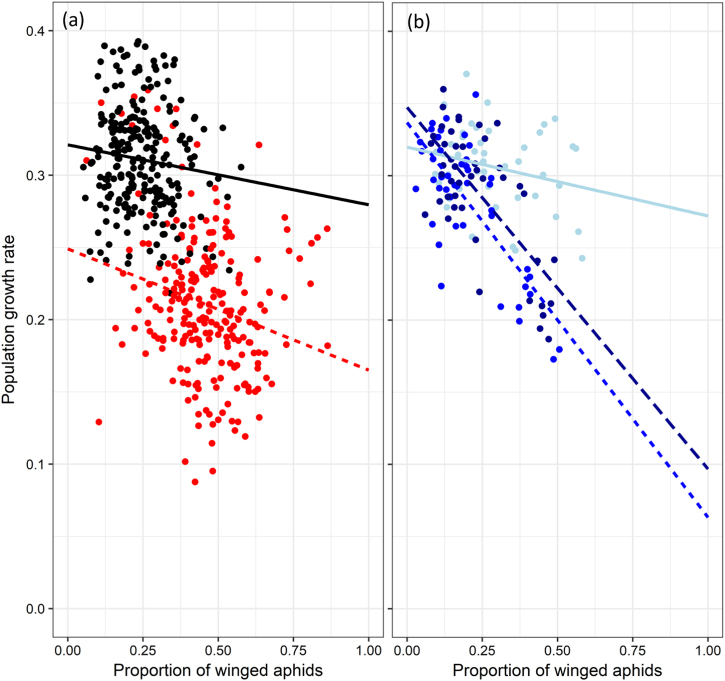
Fig. 4.
Relationship between the proportion of winged adult aphids and the population growth rate in the main experimental lines (a) without (black dots and full black line) and with predators (red dots and dashed red line), and (b) in the branch experimental lines for which predators were removed after generations 3 (light blue dots and full light blue line), 13 (blue dots and short-dashed blue line), and 22 (dark blue dots and long-dashed dark blue line). Repeated measures correlation tests (Bakdash and Marusich 2017): main experimental lines without predators (r = −0.11 df = 233, p = 0.09); main experimental lines with predators (r = −0.23, df = 233, p = 0.0004); branch experimental lines for which predators were removed after generations 3 (r = −0.38, df = 35, p = 0.02), 13 (r = −0.79, df = 35, p < 0.0001), and 22 (r = −0.73, df = 35, p < 0.0001)

