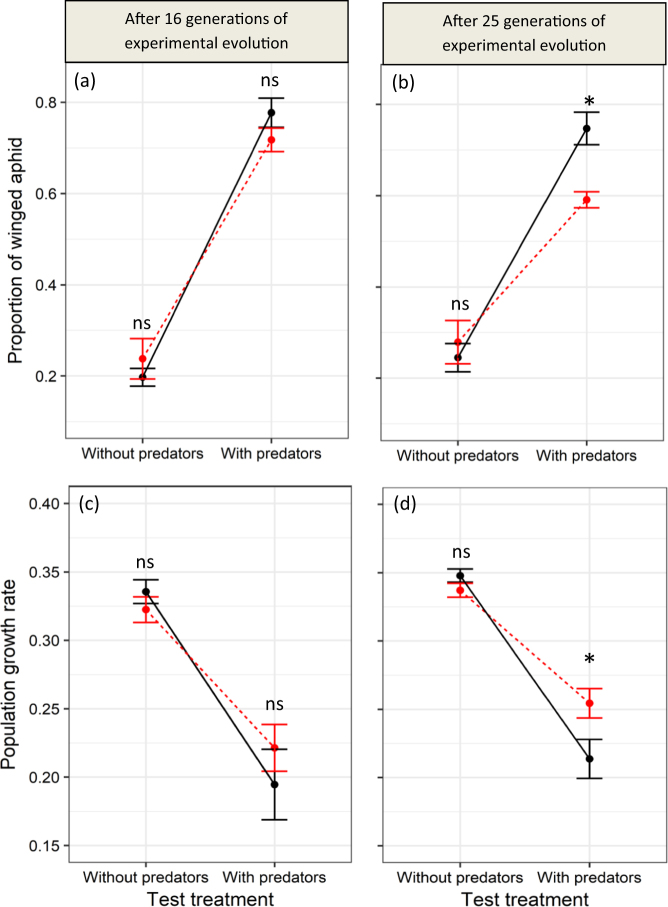
Fig. 5.
Change in aphid plastic response and population growth rate between the 16th and the 25th generation of experimental evolution. Here we illustrate the differences in plasticity in the additional experiments for experimental lines that were isolated after 16 and 25 generations of experimental evolution (first and second column, respectively). Changes in proportions of winged adult aphids (mean ± SE) are represented in a and b, and changes in aphid population growth rates (mean ± SE) are represented in c and d. The plastic response is observed across environments (absence and presence of predators corresponding to the Test Predation Treatment represented on the x-axes) by comparing the change in the phenotype values represented along the y-axes for aphids continuously exposed or never exposed to predators (red and black dots, respectively) during experimental evolution. “*” or “NS” denote significance (P < 0.05, or P > 0.05, respectively) of differences between evolutionary predation treatments (i.e., the presence/absence of predators during experimental evolution)

