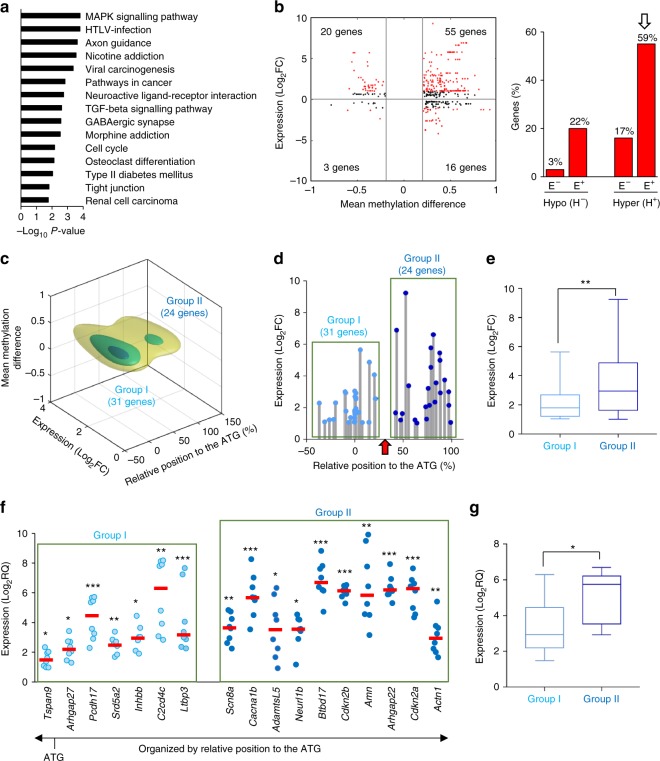
Fig. 3.
Alb-R26Met tumours are characterised by an enrichment in genes overexpressed and with hypermethylated CGIs. a Histogram reporting the KEGG pathway enrichment analysis for genes with changes in CGI methylation and expression in Alb-R26Met tumours, ordered according to the −Log10 P-value. b Left: Methylation differences versus expression for all genes with CGIs hypermethylated (H+) or hypomethylated (H−) in Alb-R26Met tumours. Expression values are relative to controls. Dots correspond to single differentially methylated CpG and the corresponding gene expression (genes which expression is significantly below or above Log2FC ± 1 are indicated in red). Right: Graph reporting the percentage of downregulated (E−) and upregulated (E+) genes among those with a hypomethylated (H−) or hypermethylated (H+) CGI. Note the enrichment of genes overexpressed and with hypermethylated CGIs (indicated by an arrow), on which subsequent studies were focused. c For the 55 genes overexpressed and with hypermethylated CGI in Alb-R26Met tumours, 3D density plot shows their distribution according to relative position to the ATG (as percentage), gene expression level (as Log2FC) and CGI methylation (as β-value difference). Note that genes segregate into two groups, according to their relative position to the ATG. d Graph reporting the individual expression level (as Log2FC; from RNA-seq data) of hypermethylated and overexpressed genes found in Alb-R26Met tumours compare to controls. Note that the relative position of the hypermethylated CGI to the ATG well segregate the two groups (indicated with a red arrow). e Box plot illustrating the global expression levels of genes in Group-I and Group-II. f Graph reporting individual expression levels (as Log2FC; by RT-qPCR) of genes belonging to the two groups in Alb-R26Met tumours (n = 8) relative to control livers (n = 6). Red lines report the median Log2FC in expression. Note that genes are distributed according to the location of the hypermethylated CGI relative to the ATG. g Box plot showing the global Log2FC in expression (according to data in F) of genes in Group-I and Group-II. In e and g, the median is reported by a line and bars extend to the minimum/maximum values. Significance is indicated on the top. *P < 0.05, **P < 0.01, ***P < 0.001

