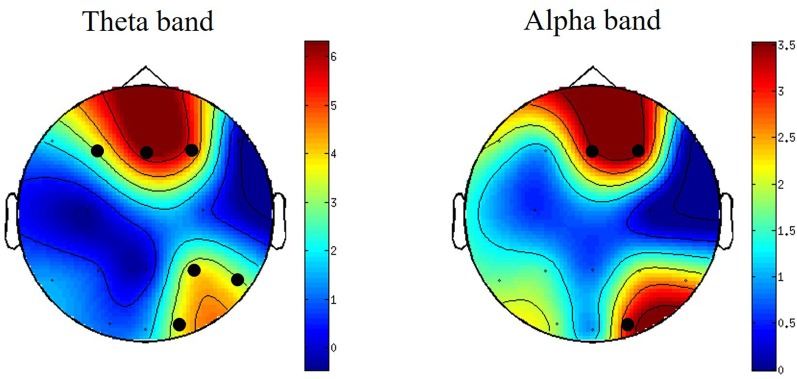
Figure 2.
Topographically distributed independent-samples t-values for theta- and alpha-band power differences when watching S vs. N-S videos. For graphical purposes, the surface in between electrodes is interpolated to create scalp maps. Clusters with significant t-values are indicated by black circles. The colors bars indicate the t-values of the clusters. N = 23.

