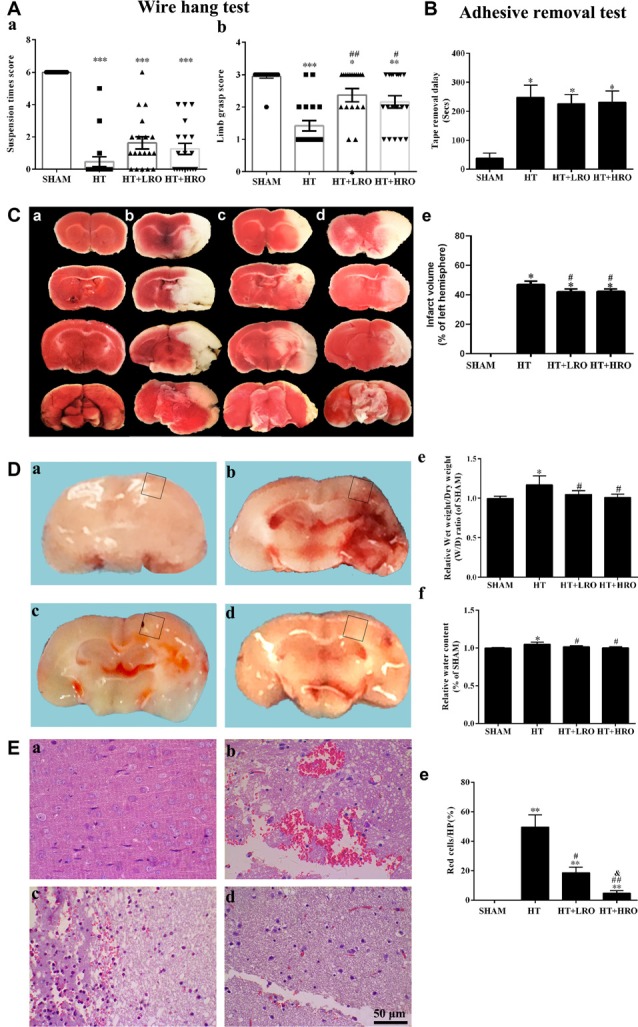
Figure 2.

Rosuvastatin attenuated hemorrhagic transformation (HT) after recombinant tissue plasminogen activator (rt-PA) reperfusion in mice. (A) Quantitative analysis of the wire hang test (n = 5 in each group) in the SHAM (sham-operated), HT (3 h of middle cerebral artery occlusion (MCAO) followed by tPA reperfusion), HT+LRO (rosuvastatin pretreatment for 10 min before MCAO followed by tPA reperfusion), and HT+HRO (rosuvastatin 5 mg/kg pretreatment for 10 min before MCAO followed by tPA reperfusion) groups. (a) The hang duration scores were expressed as the mean ± SEM, and between-group differences were assessed by one-way ANOVA followed by Tamhane’s T2 test (homogeneity of variance was not determined), n = 5. ***P < 0.001 vs. the SHAM group. (b) The grasp power scores were expressed as the mean ± SEM, and between-group differences were assessed by one-way ANOVA followed by Tamhane’s T2 test (homogeneity of variance was not determined), n = 5. *P < 0.05, **P < 0.01, and ***P < 0.001 vs. the SHAM group, ##P < 0.01 vs. the HT group, #P < 0.05 vs. the HT group. (B) Adhesive removal test (n = 5 in each group) in the SHAM, HT, HT+LRO, and HT+HRO groups. The adhesive removal duration scores are expressed as the mean ± SEM, and between-group differences were assessed by one-way ANOVA followed by Tamhane’s T2 test (homogeneity of variance was not determined), n = 5. *P < 0.05 vs. the SHAM group. (C) Representative images of TTC staining from the four groups (a–d for the SHAM, HT, HT+LRO and HT+HRO groups, respectively). (e) The infarction volume scores were expressed as the mean ± SEM, and between-group differences were assessed by one-way ANOVA followed by the LSD test (homogeneity of variance was determined), n = 3 per group. *P < 0.05 vs. the SHAM group, #P < 0.05 vs. the HT group. (D) Representative images of gross brain sections from the four groups (a–d for the SHAM, HT, HT+LRO and HT+HRO groups, respectively). (e) Relative wet weight/dry weight (WW/DW) ratios in the four groups. (f) Brain water contents (%) in the four groups. The values were expressed as the mean ± SEM, the determination of which was followed by the LSD test (homogeneity of variance was determined), n = 5. *P < 0.05 vs. the SHAM group, #P < 0.05 vs. the HT group. (E) The pathological changes in the number of red blood cells in the ischemia penumbra determined under high-power (HP) microscopy in the four groups (a–d for the SHAM, HT, HT+LRO and HT+HRO groups, respectively). (e) The values were expressed as the mean ± SEM, and between-group differences were assessed by one-way ANOVA followed by Tamhane’s T2 test (homogeneity of variance was not determined), n = 5. **P < 0.01 vs. the SHAM group, #P < 0.05 and ##P < 0.01 vs. the HT group, &P < 0.05 vs. the HT+LRO group.
