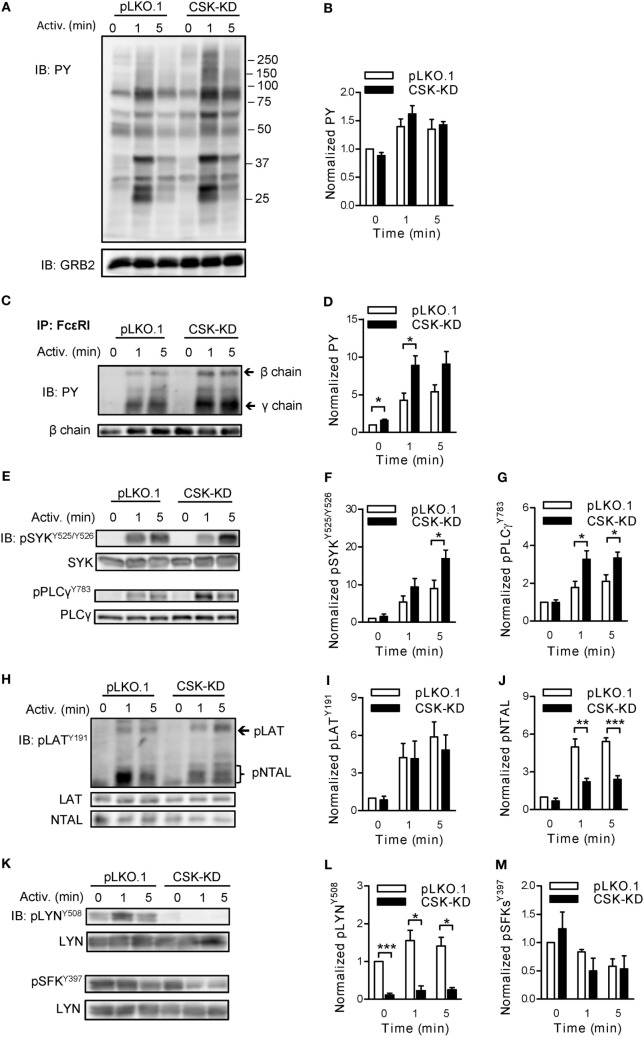
Figure 2.
Negative and positive regulatory roles of C-terminal Src kinase (CSK) in tyrosine phosphorylation of early signal-transduction molecules. (A) Total tyrosine phosphorylation of IgE-sensitized bone marrow-derived mast cells (BMMCs) with CSK-KD or control pLKO.1 cells activated or not with antigen (250 ng/ml) for various time intervals. The cells were lysed and analyzed by immunoblotting (IB) with tyrosine-specific monoclonal antibodies PY20-HRP conjugate (PY). GRB2 was used as a loading control. Representative immunoblots from three experiments are shown. Numbers on the right indicate positions of molecular weight standards. (B) Densitometry analysis of the immunoblots as from panel (A). (C) FcɛRIs were immunoprecipitated (IP) from the lysates of nonactivated or antigen-activated BMMCs with CSK-KD or control cells (pLKO.1). The immunoprecipitates were examined by immunoblotting with PY20-HRP conjugate. For loading controls, FcɛRI β chain-specific antibody was used. Positions of FcɛRI β and γ chains are marked by arrows. A representative immunoblot from three performed is shown. (D) Densitometry analysis of the immunoblots as from panel (C), in which pooled signals from tyrosine-phosphorylated FcεRI β and γ chains in activated cells were normalized to the signals from nonactivated cells and loading control protein (FcεRI β chain). Means ± SEM were calculated from three independent experiments. (E–M) IgE-sensitized BMMCs with CSK-KD or control pLKO.1 cells were activated with antigen for various time intervals and whole-cell lysates were analyzed by immunoblotting for tyrosine phosphorylated SYK [pSYKY525/Y526; (E,F)], and PLCγ [pPLCγ783; (E,G)]. Tyrosine phosphorylated LAT [pLATY191; (H,I)] was analyzed with anti-LATY191 antibody, which recognizes also phosphorylated NTAL [pNTAL; (H,J)]. Tyrosine phosphorylated LYN [pLYNY508; (K,L)] and pSFKsY397 (K,M) were analyzed with the corresponding antibodies. Representative immunoblots for each phosphorylated protein with corresponding loading controls are shown (E,H,K). The results in (F,G,I,J,L,M) show densitometry analysis of the corresponding immunoblots in which signals from tyrosine-phosphorylated proteins in activated cells were normalized to the signals in nonactivated cells and loading control proteins. Means ± SEM were calculated from 4–7 independent experiments. Statistical significance of differences between CSK-KD and pLKO.1 cells was determined using unpaired two-tailed Student’s t-test. *P < 0.05; **P < 0.01; and ***P < 0.001.

