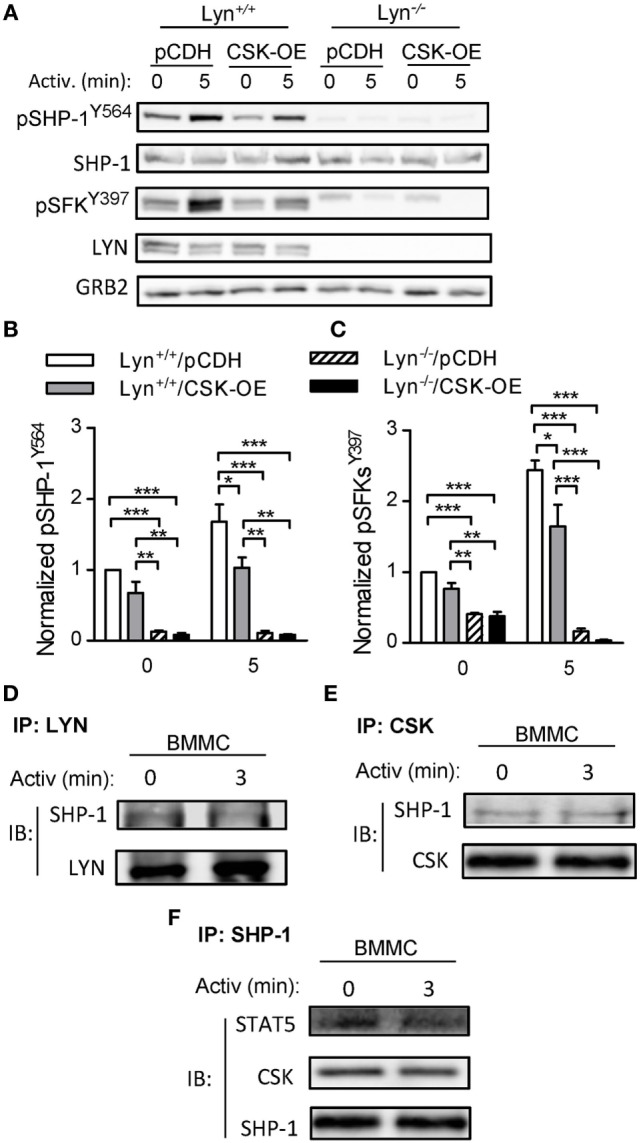
Figure 5.

Tyrosine phosphorylation of SHP-1Y564 and pSFKY397 in Lyn+/+ and Lyn−/− bone marrow-derived mast cells (BMMCs) lines with C-terminal Src kinase (CSK)-OE and controls and physical interactions among CSK, LYN, SHP-1, and STAT5 in WT BMMCs. (A) IgE-sensitized Lyn+/+ or Lyn−/− stable BMMC lines with CSK-OE or control pCDH were activated or not with antigen (250 ng/ml) and whole-cell lysates were analyzed by immunoblotting for tyrosine phosphorylated SHP-1Y564 (pSHP-1Y564) and Src family tyrosine kinases (SFKs) (pSFKsY397). For loading controls, SHP-1-specific, LYN-specific, and GRB-specific antibodies were used. (B) Densitometry analysis of the immunoblots as in panel (A), in which signals from tyrosine-phosphorylated SHP-1Y564 were normalized to the signals from nonactivated Lyn+/+/pCDH control cells and loading control protein (SHP-1). (C) Densitometry analysis of tyrosine-phosphorylated SFKs (pSFKsY397) performed as in (B) with GRB2 as a loading control protein. (D–E) Coimmunoprecipitation experiments. (D) Nonactivated or antigen-activated BMMCs were lysed and immunoprecipitated with an antibody specific for LYN kinase. The immunocomplexes were examined by immunoblotting with antibody specific for SHP-1. LYN-specific antibody was used as a loading control. (E) Cell lysates were obtained as in (D) and immunoprecipitated with antibody specific for CSK. The immunocomplexes were examined by immunoblotting with protein-specific antibodies to determine presence of SHP-1 and CSK, used as a loading control. (F) Cell lysates were obtained as in (D) and immunoprecipitated with an antibody specific for SHP-1. The immunocomplexes were examined by immunoblotting with protein-specific antibodies to determine presence of CSK and STAT5; SHP-1 was used as a loading control. Representative data from three independent experiments are shown in (A,D–F). Means ± SEM in (B,C) were calculated from three independent experiments. Statistical significance of intergroup differences in (B,C) was determined using one-way ANOVA with Tukey’s post-test. *P < 0.05; **P < 0.01; and ***P < 0.001.
