
FIGURE 2.
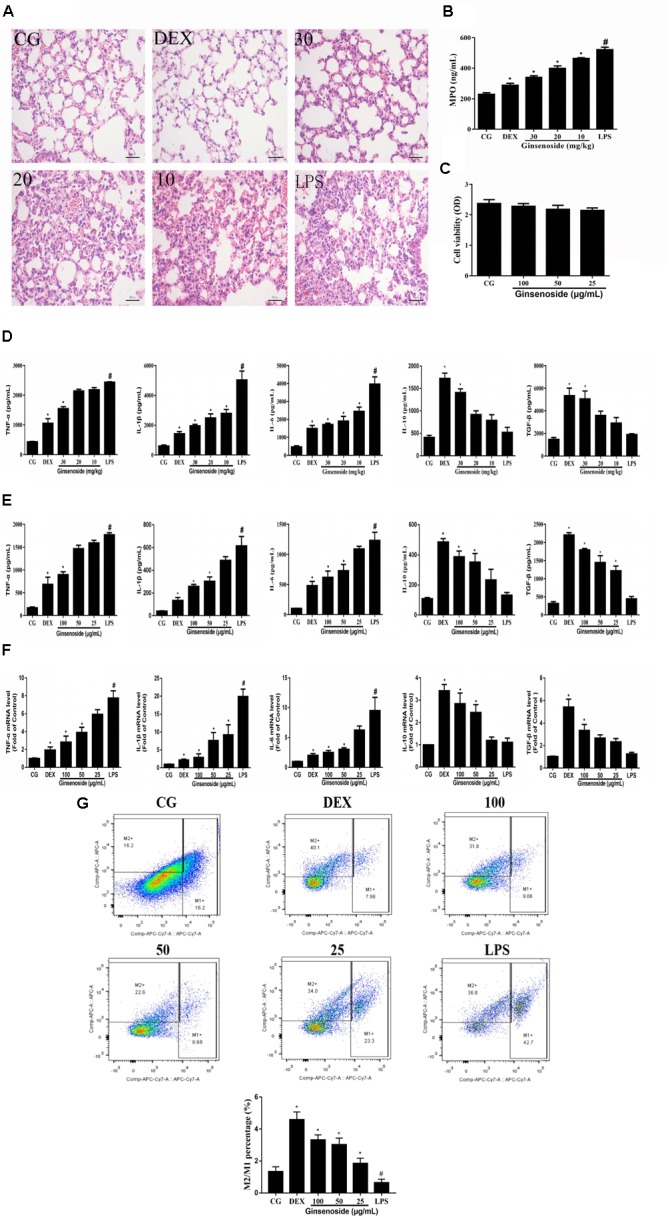
Anti-inflammatory effects of ginsenoside Rg3 in WT mice. (A) Histopathological analysis in lung tissues in WT mice. (B) The production of MPO of lung tissues in WT mice. (C) Effects of ginsenoside Rg3 on cell viability. (D) The proteins expression levels of TNF-α, IL-1β, IL-6, IL-10 and TGF-β in lung tissues were measured by ELISA. (E) The proteins expression levels of TNF-α, IL-1β, IL-6, IL-10, and TGF-β in RAW264.7 cells were measured by ELISA. (F) The mRNA expression levels of TNF-α, IL-1β, IL-6, IL-10, and TGF-β in RAW264.7 cells were measured by qPCR. β-actin was used as a control. (G) Effects of ginsenoside Rg3 on LPS-induced macrophage polarization in RAW264.7 cells. M1 macrophages were labeled with FITC Rat Anti-Mouse CD11b, PE Rat Anti-Mouse F4/80, APC-Cy7 Hamster Anti-Mouse CD11c and PE-Cy7 Rat Anti-Mouse CD16/CD32 antibodies. M2 macrophages were labeled with PE Rat Anti-Mouse F4/80, FITC Rat Anti-Mouse CD11b and Rat Anti-Mouse CD206 antibodies. The M2/M1 ratio in RAW264.7 cells was analyzed by flow cytometry. Gating was performed on F4/80+ cells. CG is the control group. LPS is the LPS-stimulated group. DEX is the dexamethasone group. Ginsenoside (10, 20, and 30) represent ginsenoside Rg3 (10, 20, and 30 mg/kg) + LPS in animals and Ginsenoside (25, 50, and 100) represent ginsenoside Rg3 (25, 50, and 100 μg/mL) + LPS in cells, respectively. The data are presented as the mean ± SEM of three independent experiments. ANOVA, p < 0.01, post hoc #p < 0.05 vs. CG. ∗p < 0.05 vs. LPS group.