
FIGURE 3.
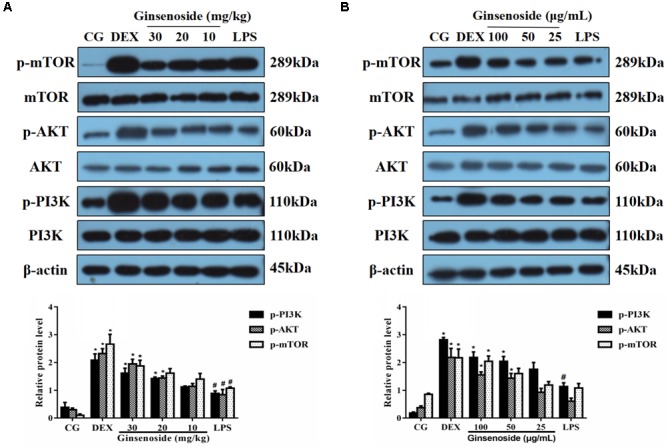
Effects of ginsenoside Rg3 on LPS-induced activation of the PI3K/AKT/mTOR pathway in WT groups. (A) The levels of PI3K, AKT and mTOR proteins in lung tissues were measured by western blotting. (B) The levels of PI3K, AKT and mTOR proteins in RAW264.7 cells were measured by western blotting. β-actin was used as a control. CG is the control group. LPS is the LPS-stimulated group. DEX is the dexamethasone group. The data are presented as the mean ± SEM of three independent experiments. ANOVA, p < 0.01, post hoc #p < 0.05 vs. CG. ∗p < 0.05 vs. LPS group.