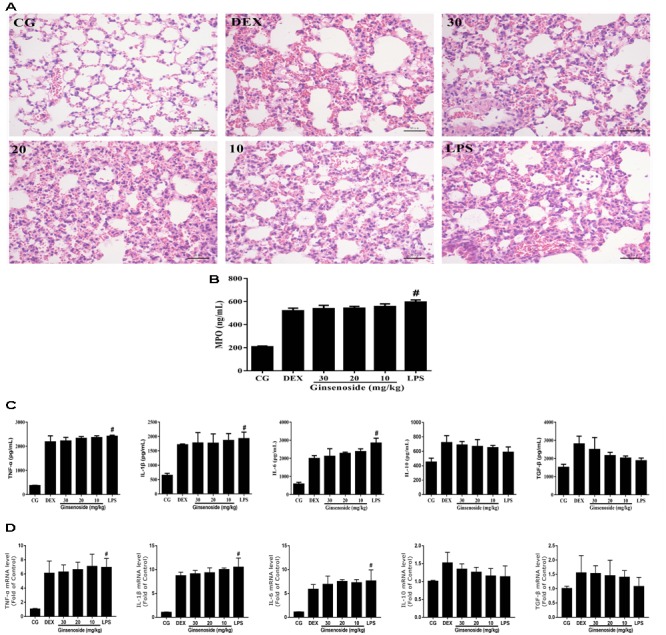
FIGURE 5.

Anti-inflammatory effects of ginsenoside Rg3 in MerTK-/- mice. (A) Histopathological analysis of lung tissues in MerTK-/- mice. (B) The production of MPO in lung tissues in MerTK-/- mice. (C) The protein expression levels of TNF-α, IL-1β, IL-6, IL-10, and TGF-β in lung tissues of MerTK-/- mice were measured by ELISA. (D) The mRNA expression levels of TNF-α, IL-1β, IL-6, IL-10, and TGF-β in lung tissues of MerTK-/- mice were measured by qPCR. β-actin was used as a control. CG is the control group. LPS is the LPS-stimulated group. DEX is the dexamethasone group. Ginsenoside (10, 20, and 30) represent ginsenoside Rg3 (10, 20, and 30mg/kg) + LPS in animals. The data are presented as the mean ± SEM of three independent experiments. ANOVA, p < 0.01, post hoc #p < 0.05 vs. CG.
