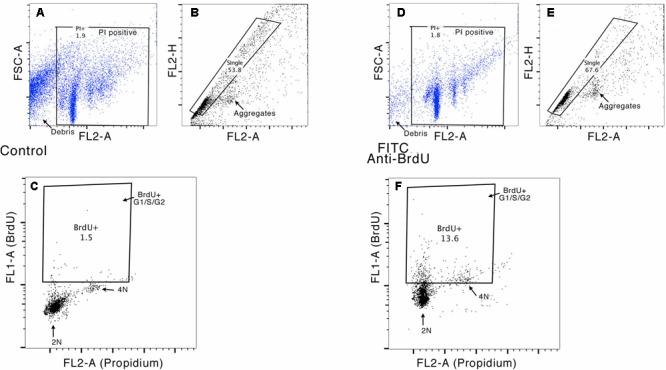
FIGURE 4.

Example of the gating strategy for flow cytometry analysis. In this sample gating performed on OL neurons, cells were first gated for Propidium Iodide staining, to exclude debris (FL2-A vs. FSC-A, see panels A and D) and then gated for singlets (FL2-H vs. FL2-A, see panels B and E), to exclude cell doublets. This cell population was further analyzed for their uptake of BrdU versus DNA content (FL1-H vs. FL2A). Panels C and F show the gates used to evaluate the percentage of cells in S and G2/M phase (stained with PI) and to measure the percentage of BrdU-positive cells (DNA content ranging between G1 and G2).
