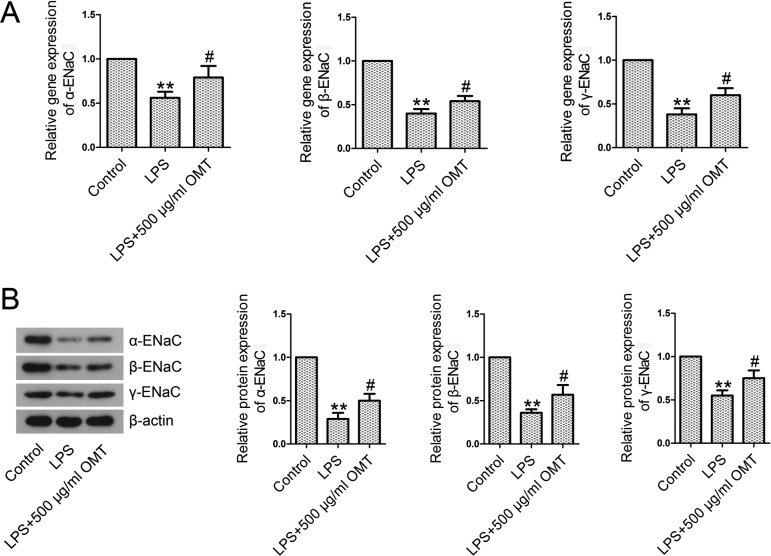
Fig. 7.
ENaC subunits in rat type II alveolar epithelial cells. The cells were treated with 500 µg/ml OMT; 30 min later, the cells were exposed to LPS (15 µg/ml) for 6 h. A. Real-time PCR analysis of α-ENaC, β-ENaC, and γ-ENaC. B. Western blotting analysis of α-ENaC, β-ENaC, and γ-ENaC. Data are expressed as the mean ± SD. Results were analyzed by one-way ANOVA followed by Bonferroni post hoc test. **P<0.01 compared with the control group. #P<0.05 compared with the LPS group.

