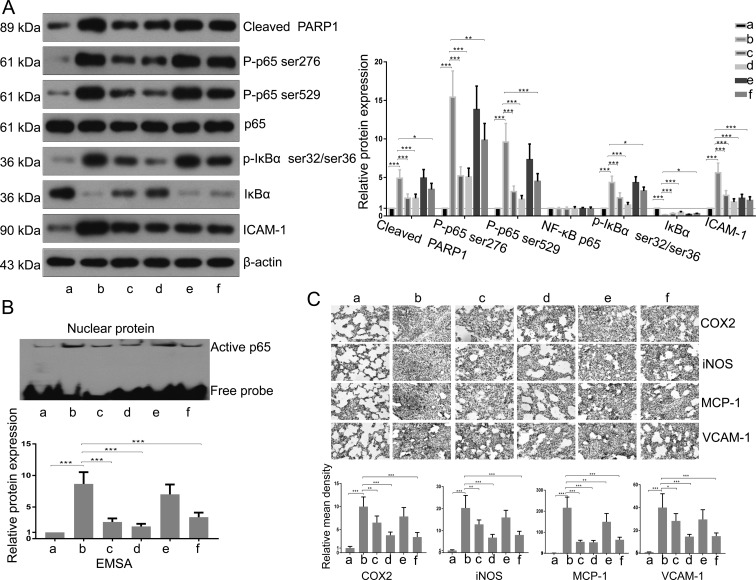
Fig. 4.
Treatment with TXA attenuated the PARP1/NF-κB signaling pathway.(A) The expression levels of cleaved PARP1, p65, p-p65 Ser276, p-p65 Ser529, IκBα, p-IκBα, and ICAM-1 were detected by western blotting. The bands were semiquantitatively evaluated by densitometry, and the data were normalized to those of the internal control, β-actin. (B) Active p65 was examined through EMSA. The band (active p65) was semiquantitatively evaluated by densitometry. (C) The content of iNOS, MCP-1, COX-2, and VCAM-1 was determined by immunohistochemical analysis. The mean density of staining was calculated as the integrated optical density (IOD) sum/area. a, Sham; b, T/HS group; c, pretreatment with TXA (50 mg/kg) + T/HS group; d, pretreatment with TXA (100 mg/kg) + T/HS group; e, T/HS + posttreatment with TXA (50 mg/kg) group; f, T/HS + posttreatment with TXA group (100 mg/kg). Data are presented as the mean ± SD. *P<0.05; ** P<0.01; ***P<0.001.

