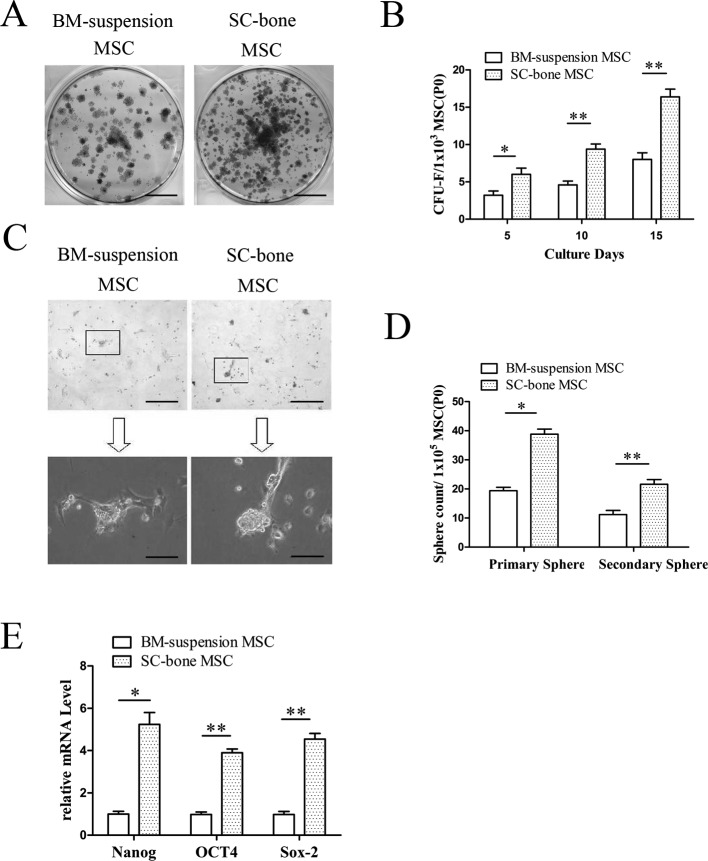
Fig. 3.
CFU-F assay, sphere formation assay, and stemness markers. A, B: CFU-F frequency remained relatively higher in the SCB-MSC group than in the BMS-MSC group. The bar represents 1 cm in 3A. SCB-MSCs, subchondral bone-derived MSCs; BMS-MSCs, bone marrow suspension-derived MSCs. C, D: The results of primary and secondary sphere culture revealed a significant difference between the two groups. The bars represent 100 µm in 3C upper and 200 µm in 3C low, respectively. E: Comparison of mRNA expression of several stemness markers (Nanog, OCT4, and Sox-2) between two groups.

