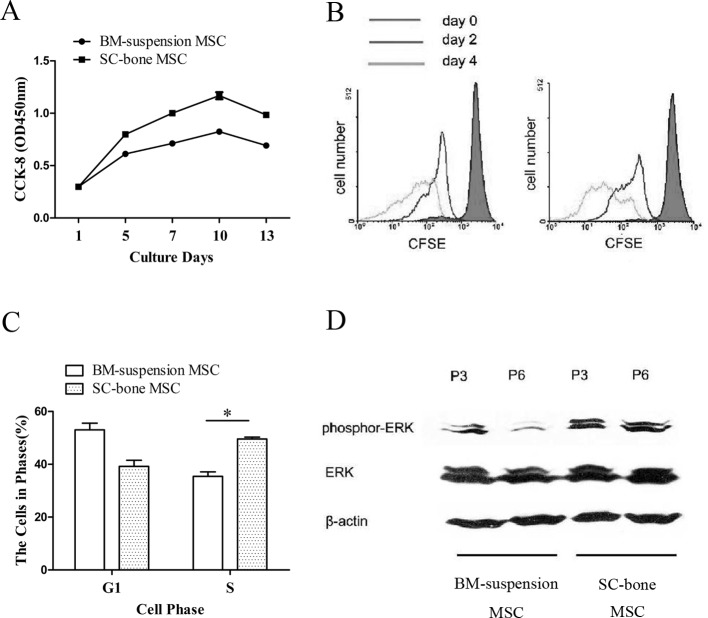
Fig. 4.
SCB-MSCs display enhanced proliferative capacity. A: CCK-8-based cell proliferation assay indicated that the SCB-MSC group harbors stronger proliferative potential than the BMS-MSC group (*P<0.05). B: CFSE data on days 2 and 4 showed that a greater proportion of SCB-MSCs underwent cell division, indicating enhanced proliferation potential. C: The results of cell cycle analysis showed a higher percentage of SCB-MSCs (50 ± 1.41%) were in the S phase compared to BMS-MSCs (36.5 ± 3.55%). D: The data showed enhanced Erk1/2 phosphorylation in passages 3 and 6 SCB-MSCs. SCB-MSCs, subchondral bone-derived MSCs; BMS-MSC, bone marrow suspension-derived MSCs.

