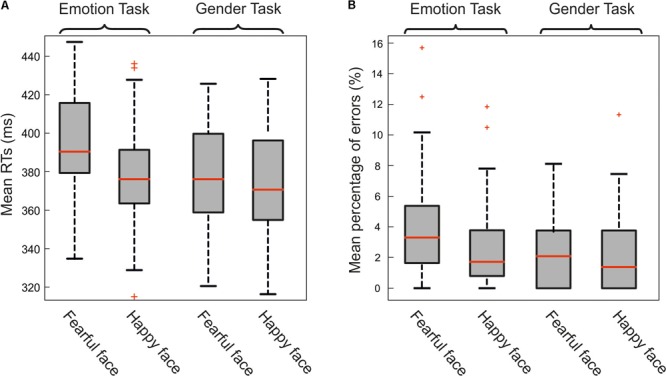
FIGURE 2.

(A) Effect of emotional facial expression on reaction times (RTs). Mean RTs to fearful and happy emotional faces in the emotion-discrimination-task (on the left) and in gender-discrimination-task (on the right). Results were split according to the gender of the participants. Overall females were faster than males and, more importantly, participants were slower when the go-signal was a fearful face than when it was a happy face just during the emotion-discrimination-task (see text for the statistics). In each box plot, the boundary of the box closest to zero indicates the first quartile, a red line within the box marks the median, and the boundary of the box farthest from zero indicates the third quartile. Whiskers indicate values 1.5 times the interquartile range below the first quartile and above the third quartile. (B) Effect of emotional facial expression on the percentage of errors. Mean percentage of errors to fearful and happy faces in the emotion-discrimination-task (on the left) and in gender-discrimination-task (on the right). Participants made a larger amount of mistakes in the emotion-discrimination-task than in the gender-discrimination-task. No differences were found between males and females (see text for the statistics).
