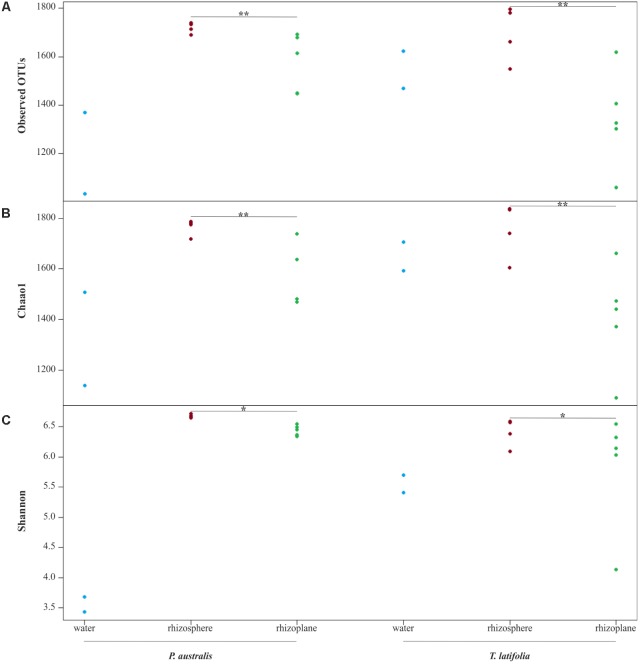
FIGURE 2.
Alpha diversity calculation. OTUs richness of water, rhizosphere, and rhizoplane microbiotas of Phragmites australis and Typha latifolia indicated by number of observed OTUs (A) and by Chao1 index (B). The OTUs evenness of the two plants microbiotas is shown by Shannon index (C). Dots represent single samples. Asterisks denote statistically significant differences between rhizosphere and rhizoplane microhabitats (∗∗p < 0.01, ∗p < 0.05).

