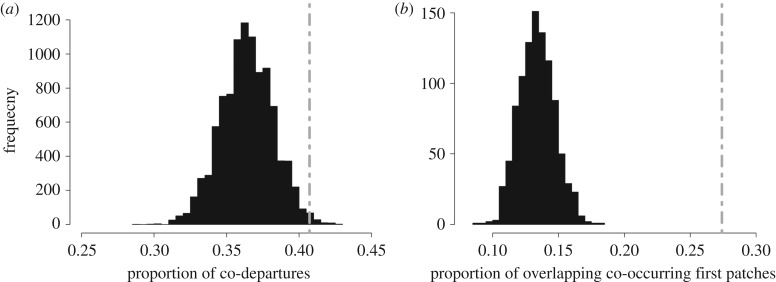
Figure 1.
Distributions of temporal overlap for (a) the proportion of trips in which at least one pair of individuals co-departed within a 3-min time window and (b) proportion of temporally co-occurring initial foraging patches that overlap in space, compared with the observed values (indicated by dashed line). Null model distributions for co-departures and patch overlap obtained from 10 000 and 1000 data permutations, respectively.

