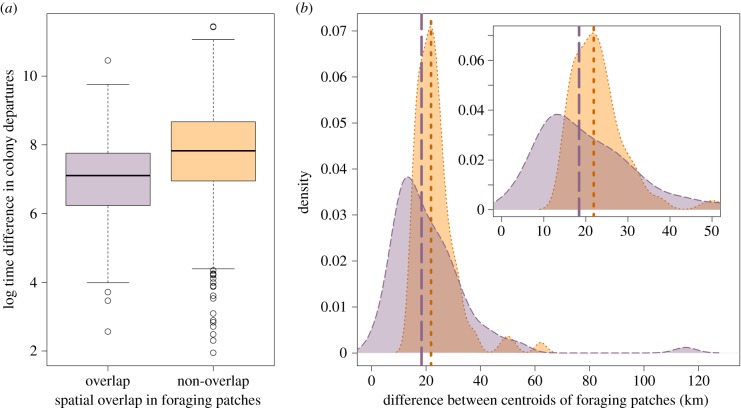
Figure 2.
Similarity between the first foraging patches and departure times of individuals. (a) Log difference in colony departure times for gannets that share a first foraging patch (purple) and those that do not (orange); (b) average difference in distance (km) between central points of the first foraging patches. Co-departing individuals are shown in dashed purple, and non-co-departing pairs are shown in dotted orange. Insert shows 95% of data, for clarity. Lines indicate median values. (Online version in colour.)

