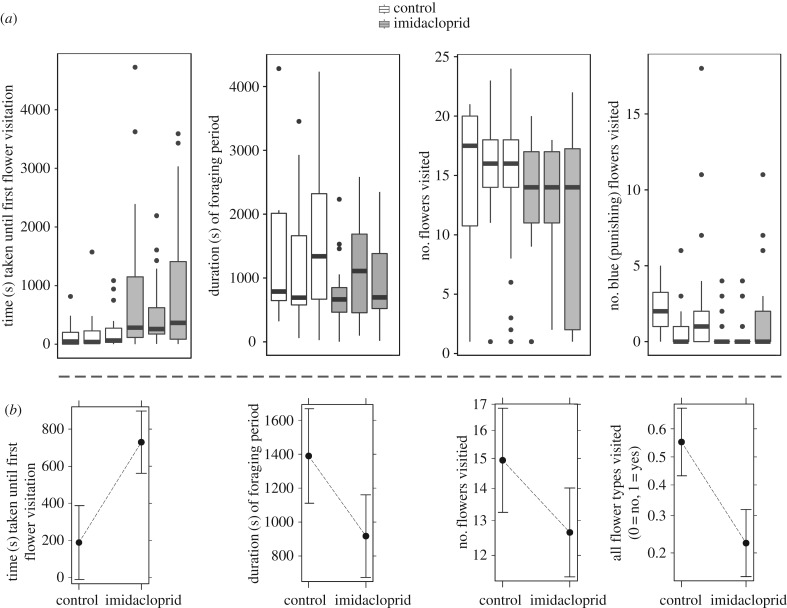
Figure 2.
Effect of 1 ppb imidacloprid treatment on bumblebee foraging behaviour. (a) Description of data (one value per bumblebee) with bumblebee colonies on the x-axis. (b) Treatment (control/imidacloprid) effect plots from LMM and GLMM modelling results related to the boxplots above. In (a), the black line indicates the median, boxes outline the 25th and 75th percentiles, and whiskers represent 1.5 times the interquartile range with data points outside that range marked as dots. In (b), black dot represents the treatment mean and the whiskers represent an estimation of the 95% confidence intervals for the mean value.

