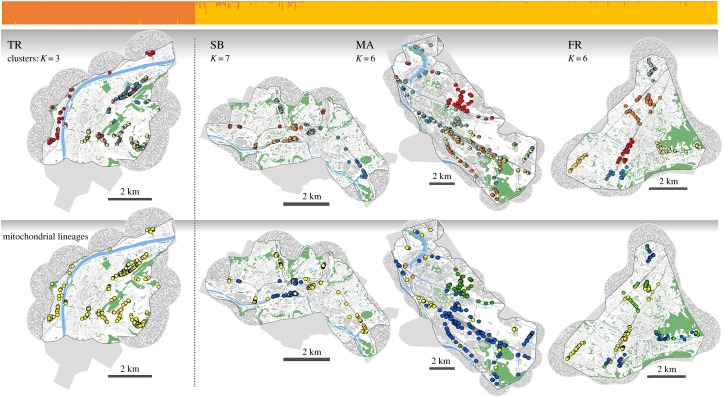
Figure 2.
Molecular results for all lizards of the four cities. A barplot at the top, above the maps, depicts genotypic results for K = 2 (ΔK = max; generated using CLUMPP) showing strongest differentiation between the city of Trier (TR: native haplotypes only) and all other cities where non-native lineages have also been found (SB: Saarbrücken; MA: Mannheim; FR: Freiburg; see electronic supplementary material, figure S1 for geographical location in Germany). The upper row of maps shows genotypic results of analyses conducted within cities, at values of K above ΔK = max; pie-charts represent cluster membership of individuals at the location of capture (based on Q-values). Lower maps show evolutionary lineages of lizards (cyt-b haplotype). The native Eastern France lineage is shown in yellow, while all other colours depict non-native lineages: Southern Alps (blue); Venetian (dark green); Tuscany (light green); Western France (orange). Within all maps, water is shown in blue, canopy cover in green. Linear, dark grey structures depict railway tracks and buildings are shown in a lighter grey. Outside of coloured maps, uniform grey areas show the sampling extent where no lizards were found. Areas without lizards were omitted from landscape genetic analyses if they fell outside of a 1 km buffer around sampled individuals. Buffers became necessary due to specifics of landscape genetic analyses and if they extended beyond the sampling extent, we generated random environmental data (represented by ‘noisy’ grey pixels inside buffers; details are given in the electronic supplementary material, section 3).

