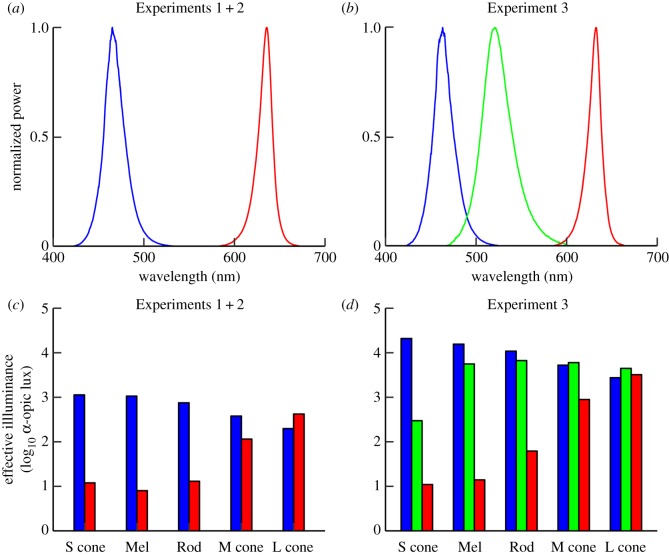
Figure 1.
Illumination characteristics. The top row shows the spectral power distribution of the red (irradiance: 178 µW cm−2) and blue (159 µW cm−2) light stimulus from Experiments 1 + 2 (a) and the red (1286 µW cm−2), green (1108 µW cm−2) and blue (2501 µW cm−2) stimuli from Experiment 3 (b). The bar plots in the bottom row indicate the activation of each of the photoreceptors in the human eye by the two stimuli from Experiments 1 + 2 (c) and the three stimuli from Experiment 3 (d). Illumination characteristics were estimated from the spectral irradiance at eye level (AvaSpec-3648-USB2 spectrometer, Avantes, Apeldoorn, The Netherlands) and described according to standard procedures (electronic supplementary material S4, table S1) [27]. S cone, short-wavelength cone; Mel, melanopsin; M cone, mid-wavelength cone; L cone, long-wavelength cone.

