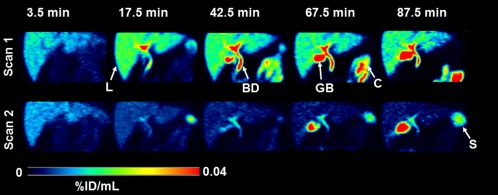
Figure 1.

Representative PET images (subject 4) of the abdominal region for baseline scan (scan 1) and scan after oral intake of erlotinib (scan 2) recorded at 3.5, 17.5, 42.5, 67.5, and 87.5 min after radiotracer injection. Radioactivity concentration is expressed as percent of the injected dose per mL (%ID/mL) and radiation scale is set from 0 to 0.04. Anatomical structures are labeled with arrows (L, liver; GB, gall bladder; BD, bile duct; C, colon; S, spleen).
