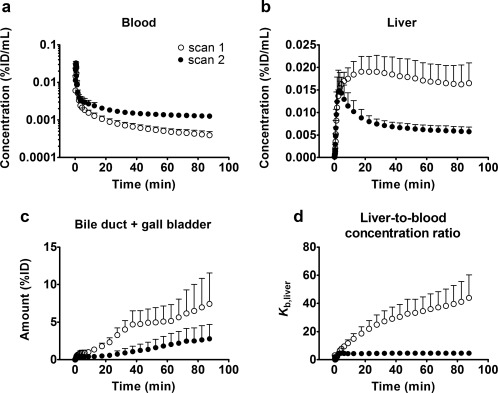
Figure 2.

Mean time–activity curves (%ID/mL or %ID ± SD, n = 6) in arterial blood (a), liver (b) and bile duct and gall bladder (c) for baseline scan (scan 1) and scan after oral intake of erlotinib (scan 2). In d, the liver‐to‐blood concentration ratio (K b,liver) over time is shown for the two scans.
