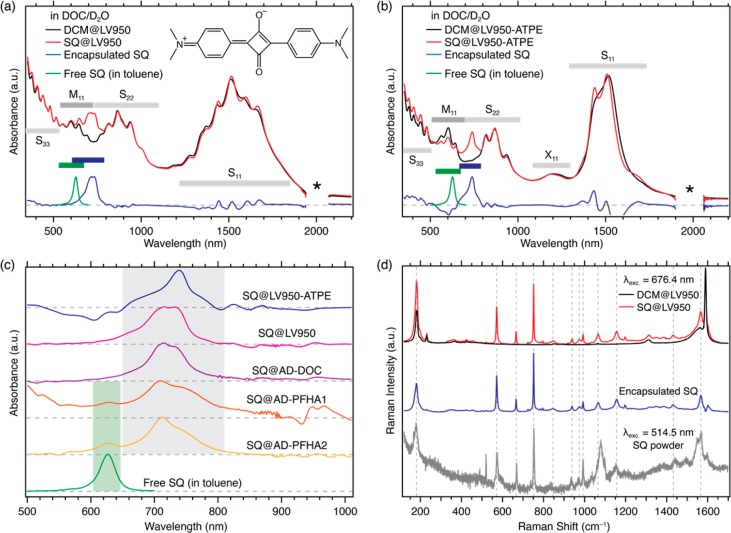
Figure 1.
Optical absorption and RRS characterization of SQ encapsulation in SWCNTs. Normalized absorption spectra of the (a) LV950 and (b) LV950-ATPE samples. SQ@SWCNT samples are denoted by red traces and reference DCM@SWCNT samples by black traces. The spectrum for the encapsulated SQ dye, obtained by subtraction of the DCM@SWCNT spectrum from the SQ@SWCNT spectrum, is identified by the blue traces. The spectrum for free SQ dye in toluene is denoted by the green trace. Ranges for the excitonic transitions for semiconducting (S11, S22, S33) and metallic (M11) SWCNTs and phonon side bands (X11) are indicated, and the region where a strong D2O absorption band complicates the background subtraction is identified by an asterisk. (c) Absorbance contribution due to encapsulated SQ for all five SWCNT samples, estimated by subtraction of the DCM@SWCNT spectrum from the SQ@SWCNT spectrum and compared to the absorption spectrum of SQ freely dissolved in toluene. (d) Raman spectra of the SQ@LV950 (red trace) and DCM@LV950 (black trace) samples excited at 676.4 nm. The spectrum of encapsulated SQ (blue trace) is obtained by subtracting the Raman spectra of DCM@LV950 from the SQ@LV950 spectrum (see SI, section 6, for other excitation wavelengths). The Raman spectrum of the pure SQ powder (gray trace) obtained at 514.5 nm is also shown.

