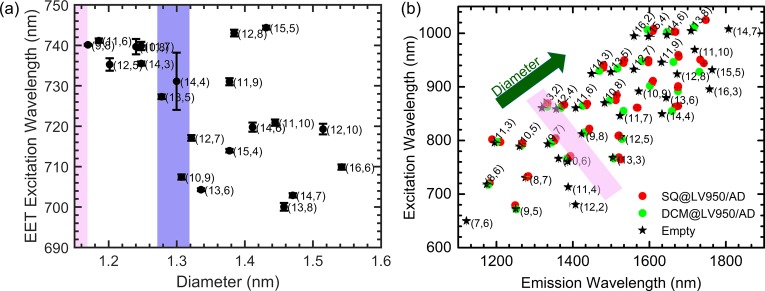
Figure 6.
(a) Position of the EET excitation peak, extracted from the 2D spectral analysis of the dye-filled PLE maps, as a function of the s-SWCNT diameter. The pink shaded area (in both panels a and b) represents the minimal encapsulation diameter range, and the purple shaded area represents the diameter range after which a more complex behavior is found with the diameter of the SWCNTs increasing according to the green arrow in panel (b) (see also main text). (b) Peak positions of empty (black stars), SQ-filled (red circles), and DCM-filled (green circles) SWCNTs as obtained from the PLE fits. A clear change in S11/S22 peak position between the SQ- and DCM-filled samples can be observed for SWCNTs with diameters similar or larger than the (9,8) SWCNT, indicative of filling with the SQ-molecules, also highlighted by the pink shaded area.

