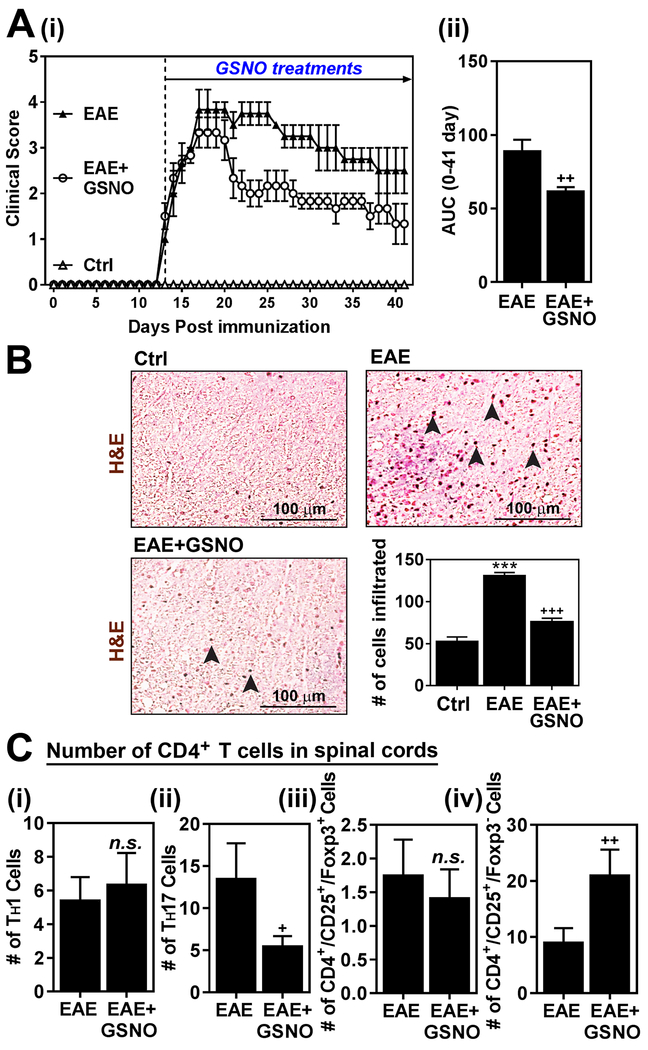
Figure 1. Exogenous GSNO treatment attenuates EAE disease.
A. C57BL\6 mice (n=6) immunized with MOG peptide were treated with GSNO (1mg/kg/day) on the day of disease onset (day 14 post-immunization). Following the immunization and GSNO treatment, clinical signs of EAE disease were assessed daily as described in materials and methods (i). The area under the curve (AUC) of the overall disease severity was calculated and represented bar graph (ii). B. At the peak of EAE disease (day 20), the spinal cord infiltration of mononuclear cells was analyzed by H&E staining. The number of infiltrated cells in the H&E staining was manually counted and represented as number of cells per microscopic field (n=4). C. At the peak of EAE disease (day 20), subset specific infiltration of CD4+ cells (IFN-γ+ TH1, IL-17+ TH17, CD25+ FOXP3+ Treg, and CD25+ FOXP3+ FOXP3− Treg) in the spinal cords and brains were analyzed by fluow-cytometry analysis at the peak of disease (n=4). The graphs show mean ± standard error of the mean (SEM). *** p < 0.001 compared to control (Ctrl) group; + p < 0.05, ++ p < 0.001 compared to EAE group; n.s. = not significant.

