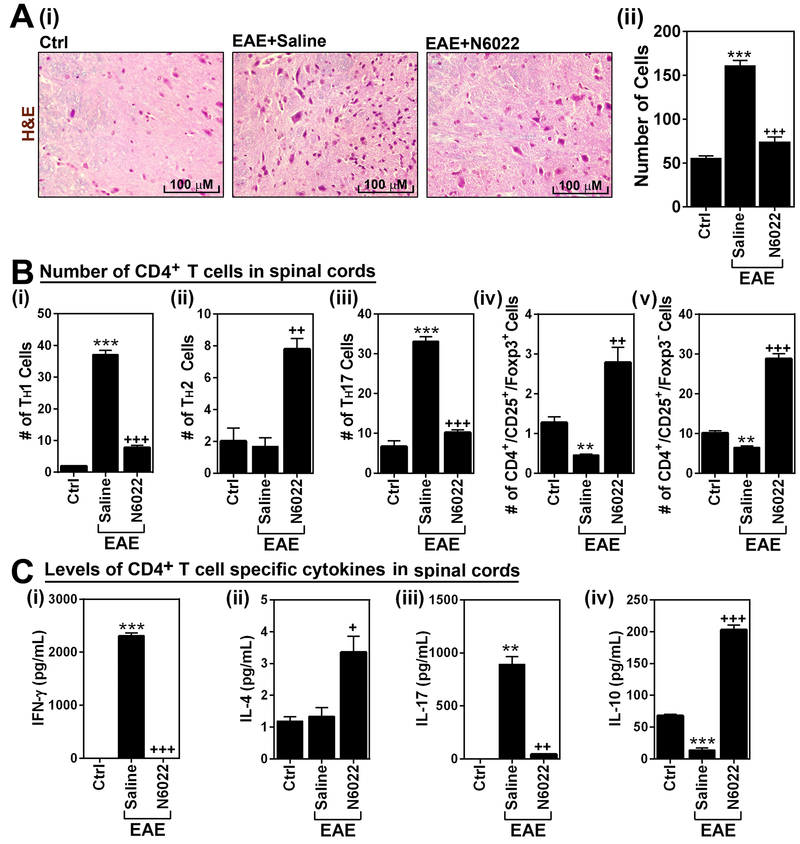
Figure 5. N6022 reduced CNS infiltration of peripheral mononuclear cells.
A. At the peak of disease (day 20), spinal cord infiltration of mononuclear cells was analyzed by histological staining of spinal cord section by H&E method (i). The number of infiltrated cells in the H&E staining was manually counted and represented as number of cells per microscopic field (n=4). (ii). B. Next, total lymphocytes were isolated from spinal cords of control (ctrl), EAE mice, and EAE mice treated with N6022 and cultured under ex vivo conditions. Following the activation with MOG peptide, the number of CD4+ cell subsets, such as IFN-γ+ TH1 (i), IL-4+ TH2 (ii), IL-17+ TH17 (iii), CD25+ FOXP3+ cells (iv), and CD25+ FOXP3− cells (v) were analyzed by fluorescence flow-cytometry analysis (n=4). C. From the culture media, the levels of CD4+ T cell subset specific cytokines, such as IFN-γ (i), IL-4 (ii), IL-17 (iii), and IL-10 (iv), were analyzed by ELISA (n=4). The graphs show mean ± standard error of the mean (SEM): ** p < 0.001, *** p < 0.0001, compared to control (Ctrl) group; + p < 0.05, ++ p < 0.001, +++ p < 0.0001 compared to EAE group.

