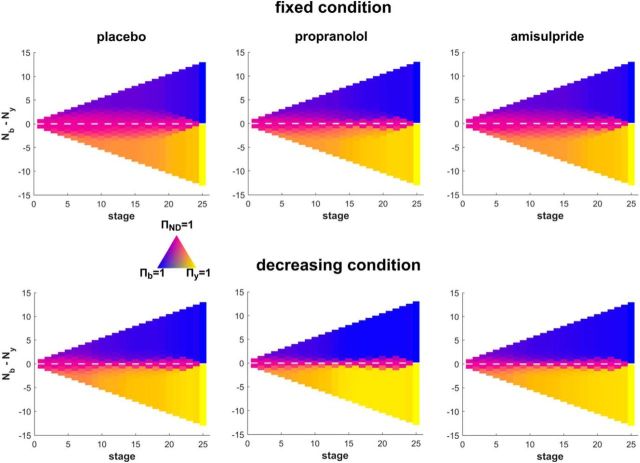
Figure 3.
Model policy reflecting the choice probability for choosing yellow, blue, or continuing sampling (pink) depending on the evidence difference (y-axis) and the information-gathering stage (x-axis). This depiction shows that subjects are less likely to sample in the decreasing condition in general (less pinkish areas). Also, one can clearly see how a nondecision area is diminished in the propranolol group (middle) compared with the placebo group (left).

