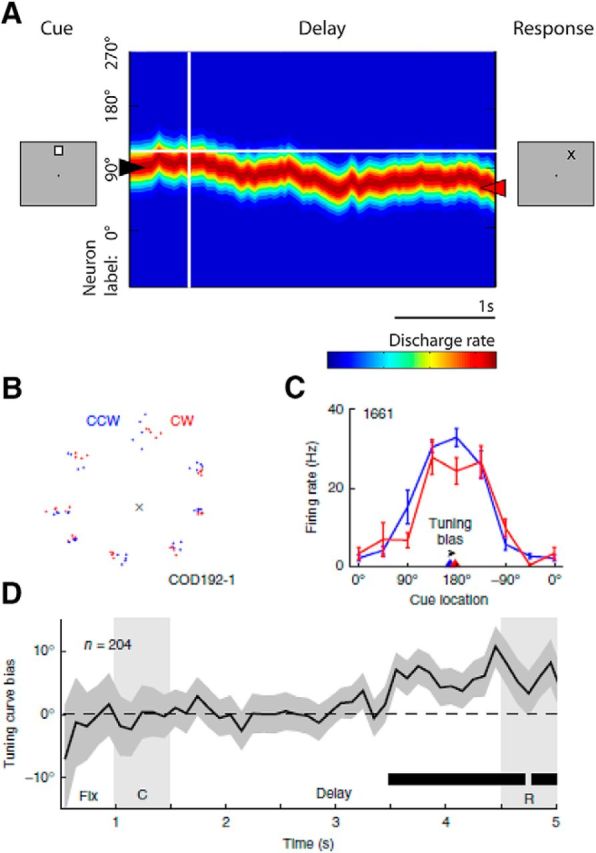
Figure 2.

A, Illustration of the bump attractor model. Appearance of a stimulus elicits activity in a network of neurons (arranged in the y-axis based on preferred location). The bump of activity drifts during the delay period. The monkey's recall is determined by the position of the bump at the end of the delay period. From Constantinidis and Klingberg (2016). B, Representation of saccade endpoints for one session. For each cue, trials are separated in half based on their relative clockwise (red) and counterclockwise (blue) saccadic responses. C, Sample neuron delay-period responses in the clockwise and counterclockwise conditions. Triangles represent the circular mean of the responses, an estimate of the cue position for each condition. The distance between these two circular means is the tuning bias. D, Population average of the tuning bias for all neurons across time showed significantly positive values by the end of the delay. From Wimmer et al. (2014).
