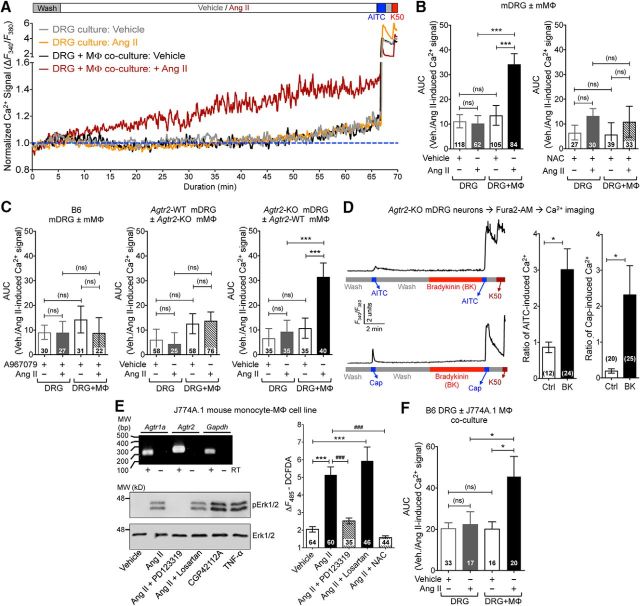
Figure 13.
Ang II-induced MΦ ROS/RNS production trans-activates TRPA1 on mouse DRG neurons. A, Representative traces of Ang II-induced (100 nm, 1 h) [Ca2+]i elevation in mouse DRG neurons observed only upon coculturing with mouse MΦs (both B6-WT mice). TRPA1+ neurons are identified by AITC (100 μm) and 50 mm KCl (K50). Area under the curve (AUC) for Ang II-induced [Ca2+]i elevation is subsequently quantified. B, C, Ang II-induced increases in DRG neuron [Ca2+]i elevation in cocultures can be completely attenuated upon coapplication of NAC (3 mm; B) and the TRPA1 antagonist A967079 (1 μm; C). Ang II (100 nm, 1 h) fails to induce [Ca2+]i elevation in FVB-Agtr2-WT DRG neurons cocultured with FVB-Agtr2-KO MΦs; however, increased [Ca2+]i is conserved in FVB-Agtr2-KO DRG neurons cocultured with FVB-Agtr2-WT MΦs (C). Data are presented as mean ± SEM. ***p < 0.001 and not significant (ns) versus respective comparison groups, one-way ANOVA with Tukey's post hoc test. D, Representative traces and quantification of bradykinin (BK; 100 nm; 5 min)-evoked potentiation of AITC-induced (50 μm) and capsaicin-induced (100 nm) Ca2+ flux in Agtr2-KO DRG neurons. Data are presented as mean ± SEM. *p < 0.05 versus control groups, one-way ANOVA with Tukey's post hoc test. E, Top left, Representative agarose gel electrophoresis images of RT-PCR amplification of AT1R and AT2R genes (Agtr1a and Agtr2) from total RNA isolated from the mouse monocyte-MΦ cell line J774A.1. Gapdh amplification is used as a positive control. Numbers on the left denote DNA molecular weight markers (in base pairs). Bottom left, Western blot images demonstrating increased Erk1/2 phosphorylation in J774A.1 cells treated with Ang II (100 nm; 30 min), the AT2R-selective agonist CGP42112A (100 nm; 30 min), or TNF-α (10 nm; 30 min) as a positive control. The Ang II-mediated increase in p-ERK1/2 is inhibited by coapplication of PD123319 (1 μm), but not losartan (1 μm). Numbers on the left denote protein molecular weight markers (in kilodaltons). Right, J774A.1 cells demonstrate AT2R-dependent increased DCFDA fluorescence, which is inhibited by PD123319 (1 μm) or the antioxidant NAC (3 mm), but not losartan (1 μm). Data are presented as mean ± SEM. ***p < 0.001 versus vehicle, ###p < 0.001 versus Ang II. F, Ang II (100 nm, 1 h) induces increase in DRG neuron [Ca2+]i elevation upon coculturing with J774A.1 MΦ cells. Data in B–F are presented as mean ± SEM and numbers shown inside each column in these panels indicate the number of DRG neurons (and MΦs for E) in ≥4 culture batches from ≥4 mice/group. **p < 0.05, ***p < 0.001, ###p < 0.001, and not significant (ns) versus the indicated comparison groups, one-way ANOVA with Tukey's post hoc test.

