
Figure 14.
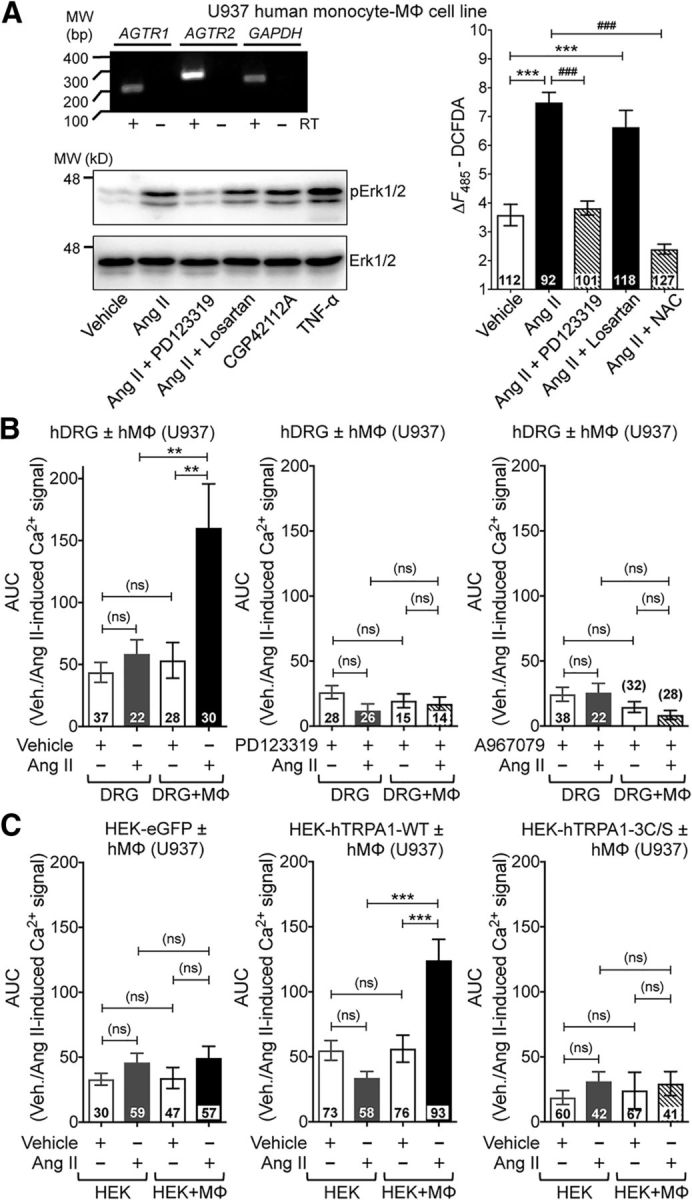
Ang II-induced MΦ ROS/RNS production in U937 human MΦ cells trans-activates TRPA1 on human DRG neurons. A, Top left, Representative agarose gel electrophoresis images of RT-PCR amplification of AT1R and AT2R genes (AGTR1 and AGTR2) from total RNA isolated from the human monocyte-MΦ cell line U937. GAPDH amplification is used as a positive control. Numbers on the left denote DNA molecular weight markers (in base pairs). Bottom left, Western blot images demonstrating increased Erk1/2 phosphorylation in U937 cells treated with Ang II (100 nm; 30 min), the AT2R-selective agonist CGP42112A (100 nm; 30 min), or TNF-α (10 nm; 30 min) as a positive control. The Ang II-mediated increase in p-ERK1/2 is inhibited by coapplication of PD123319 (1 μm), but not losartan (1 μm). Numbers on the left denote protein molecular weight markers (in kilodaltons). Right, U937 cells demonstrate AT2R-dependent increased DCFDA fluorescence, which is inhibited by PD123319 (1 μm) or the antioxidant NAC (3 mm), but not losartan (1 μm). B, Ang II (100 nm, 1 h) induces significant elevation of [Ca2+]i levels in human DRG neurons upon coculturing with the U937 human MΦ cell line, which can be completely attenuated upon coapplication of the AT2R antagonist PD123319 (1 μm) and the TRPA1 antagonist A967079 (1 μm). C, Ang II (100 nm, 1 h) induces a significant elevation in [Ca2+]i levels in HEK293 cells transfected with eGFP+hTRPA1-WT, but not with eGFP alone or eGFP+hTRPA1–3C/S mutant cDNAs, upon coculturing with U937 human MΦ cell line. Data in all panels are presented as mean ± SEM and numbers shown inside each column indicate the number of MΦs (A) and DRG neurons (B, C) in ≥4 human DRG culture batches per group. **p < 0.05, ###p < 0.001, and not significant (ns) versus the indicated comparison groups, one-way ANOVA with Tukey's post hoc test.