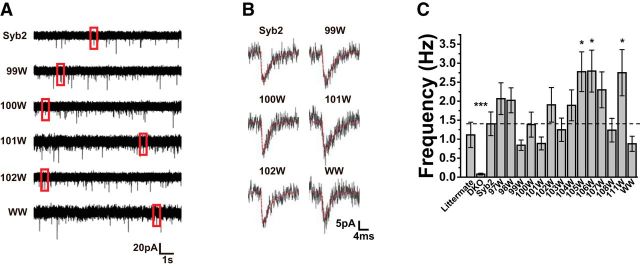
Figure 2.
A, Whole-cell patch-clamp recordings reveal mEPSCs in cells transfected with WT-Syb2 or Syb2 mutants (events in red boxes displayed in B). B, Expanding the time axis for selected events from A illustrates the characteristic shapes of mEPSCs. Thin red curves show the fitted function (Eq. 1) used to obtain kinetic parameters. C, mEPSC frequencies of littermate, DKO cells, and DKO cells transfected with WT-Syb2 and Syb2 mutants. Pairwise comparisons were conducted with the Mann–Whitney U test. The frequency in untransfected DKO cells was markedly reduced. The frequencies in neurons expressing the Syb2 mutations 105W, 106W, and 111W were nearly twofold higher than in neurons expressing WT Syb2 and the differences were statistically significant (Mann–Whitney two-tailed, 105: N = 23, U = 195, p = 0.017, 106: N = 26, U = 204, p = 0.016, 111: N = 22, U = 205, p = 0.045). *p < 0.05, ***p < 0.001.

