Figure 3.
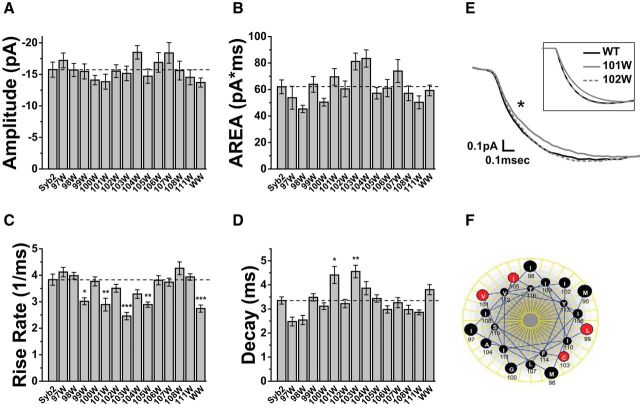
mEPSC characteristics in hippocampal neurons transfected with WT-Syb2 and Syb2 tryptophan TMD mutations. Single mutations were tested at residues 97–108 and 111. WW indicates a 101/103 double mutation (Fig. 1F). Bar graphs present the mean of cell means ± SEM, with error based on cell number (N ≥ 22). A, Amplitude and (B) area were indistinguishable between all mutants and WT. C, Max-rise-rate; four single mutations and a double tryptophan mutation produced statistically significant reductions (Bonferroni test, L99W: N = 29, t = 3.72, p = 0.024, V101W: N = 23, t = 4.03, p = 0.007, C103W: N = 26, t = 6.09, p = 3.0 × 10⁻⁷, I105W: N = 23, t = 4.04, p = 0.007; WW: N = 26, t = 4.83, p = 2.1 × 10⁻⁴). D, Decay time; two single mutations produced statistically significant increases (Bonferroni test, V101W: t = 3.72, p = 0.024, C103W: t = 4.37, p = 0.002). E, Averaged recorded mEPSCs from neurons expressing WT Syb2, 101W, and 102W to illustrate the slower onset in neurons expressing 101W. The star indicates the trace for 101W differed significantly (N = 51, p = 0.013; Kolmogorov–Smirnov test). Inset, The averages of the fitted curves to illustrate that the fitting was faithful to the raw mEPSCs. F, A Helical wheel of the Syb2 TMD shows the residues where tryptophan reduced the max-rise-rate as red. The four sites fall along two different faces. *p < 0.05, **p < 0.01, ***p < 0.001.

