Figure 7.
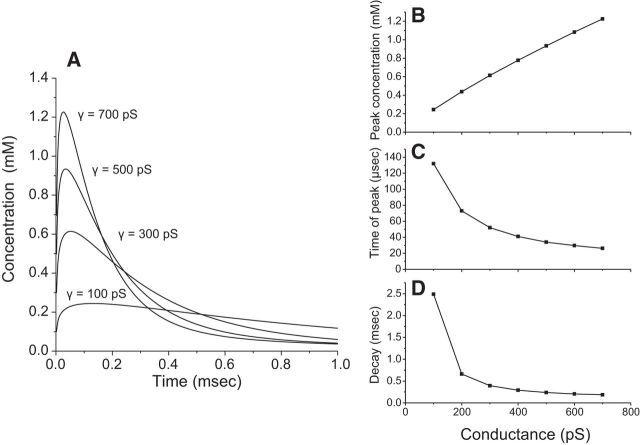
Simulations of cleft glutamate concentrations. A, Numerical integration of Equation 2 yielded the concentration versus time predicted by a diffusion model for the glutamate concentration in the synaptic cleft immediately below the site of fusion (Eq. 2). B, The peak concentration for simulations such as those in A plotted versus fusion pore conductance. C, Plot of time at peak. D, Decay time during the falling phase of the concentration transient.

