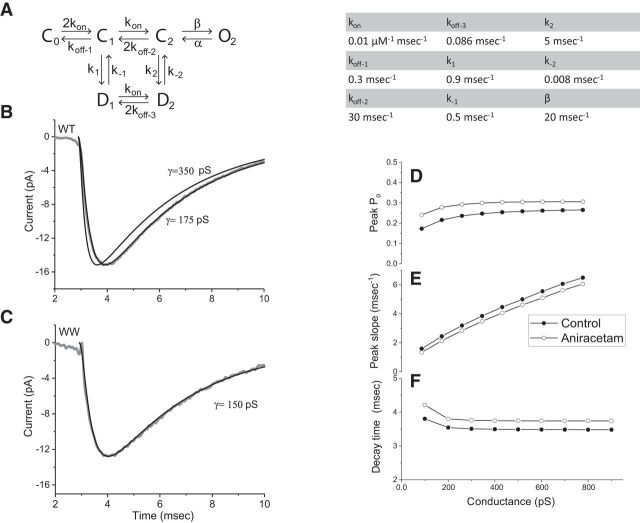
Figure 8.
Simulations of receptor activation. A, The model of Lawrence et al. (2003) was used to simulate receptor activation by glutamate emerging from a fusion pore with a given conductance using a glutamate concentration profile determined from Equation 2 as in Figure 7. The integration was performed with Mathcad 15; various differential equation solvers within this program (Rung-Kutta, Adams, Bulstoer) were tested and found to produce identical results. The following values were taken for the rate constants from Lawrence et al. (2003). kon = 0.01 μm−1 ms−1, koff-1 = 0.3 ms−1, koff-2 = 30 ms−1, koff-3 = 0.086 ms−1, k1 = 0.9 ms−1, k−1 = 0.5 ms−1, k2 = 5 ms−1, k−2 = 0.008 ms−1, and β = 20 ms−1. The value of α used by Lawrence et al. (2003) of 2.875 ms−1 is not consistent with the slow mEPSC decays observed here in mouse neurons and this value was reduced to 0.43 ms−1 to increase the decay time from 1.6 to 3.5 ms. B, The average of the mEPSCs recorded from neurons expressing WT Syb2 is displayed (gray) along with model simulations with fusion pore conductances of 175 and 350 pS. C, The average mEPSC from neurons expressing the WW mutant is displayed with a simulation identical to those in B, but with γ reduced to 150 pS to fit the data. D, Peak open probability of the AMPA receptor channel from simulations versus fusion pore conductance. For aniracetam we reduced k1 to 1.2 ms−1 and k2 to 0.8 ms−1 (based on Lawrence et al., 2003) but kept α at 0.43 ms−1; control points were represented by filled circles and aniracetam points by open circles. E, Peak rising slope versus conductance. F, Decay time versus pore conductance.

