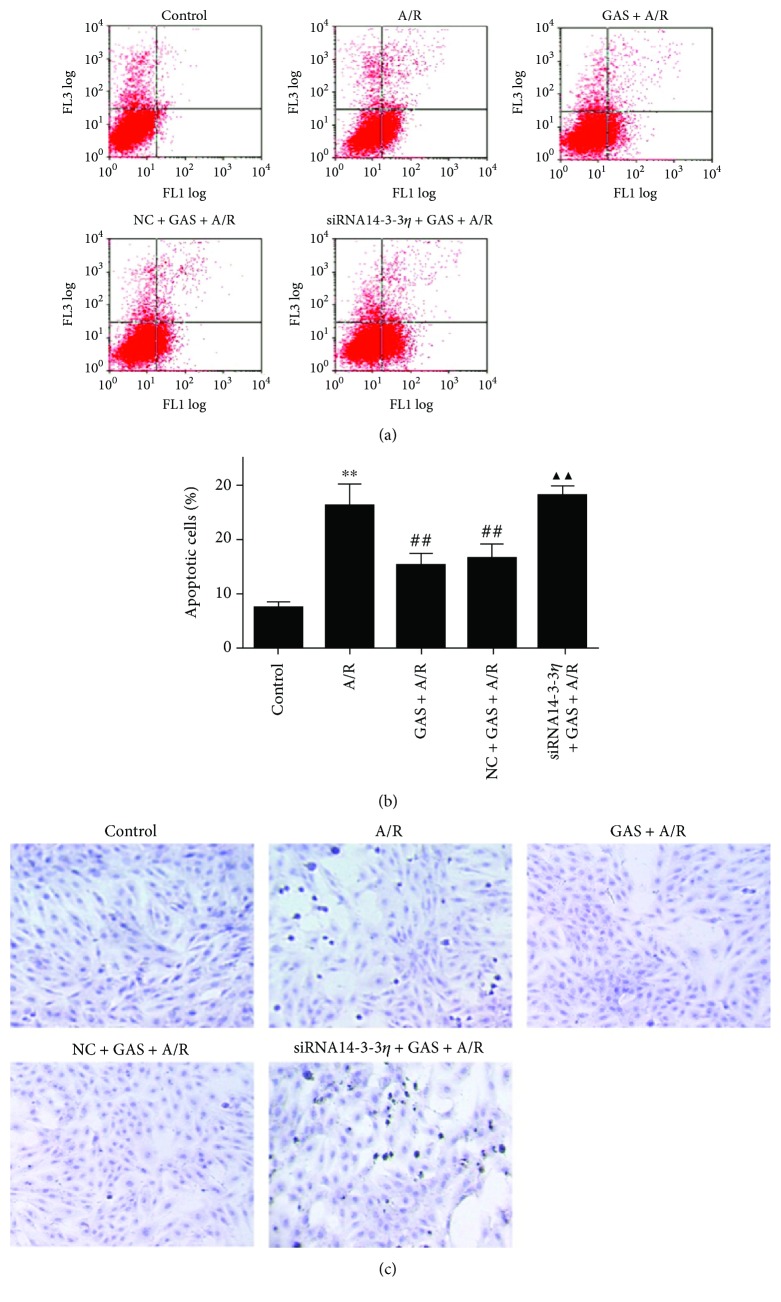
Figure 3.
The effects of pretreatment with GAS inhibited the apoptosis of cardiomyocytes exposed to A/R. (a) Representative dot plots of PI (y-axis) versus annexin V (x-axis) by flow cytometry. (b) The quantitative analysis of apoptotic cell populations. The values are expressed as the means ± SEM (n = 3). ∗∗P < 0.01 versus control group, ##P < 0.01 versus A/R group, and ▲▲P < 0.01 versus GAS + A/R group. (c) Apoptotic cardiomyocytes were detected by TUNEL, and apoptotic cells are stained brown.

