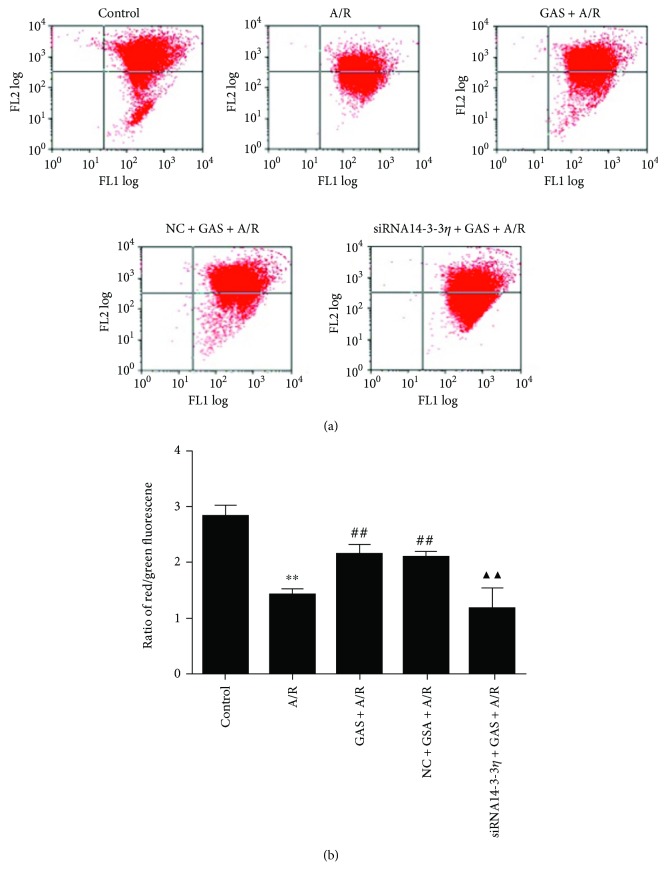
Figure 6.
Effects of GAS pretreatment on the loss of the mitochondrial membrane potential in cardiomyocytes induced by A/R. (a) Representative point diagram of flow cytometry. (b) ∆Ψm was calculated by the proportion of red/green fluorescence acquired from flow cytometry. Data are expressed as the mean ± SEM (n = 3). ∗∗P < 0.01 versus control group; ##P < 0.01 versus A/R group; ▲▲P < 0.01 versus GAS + A/R group.

