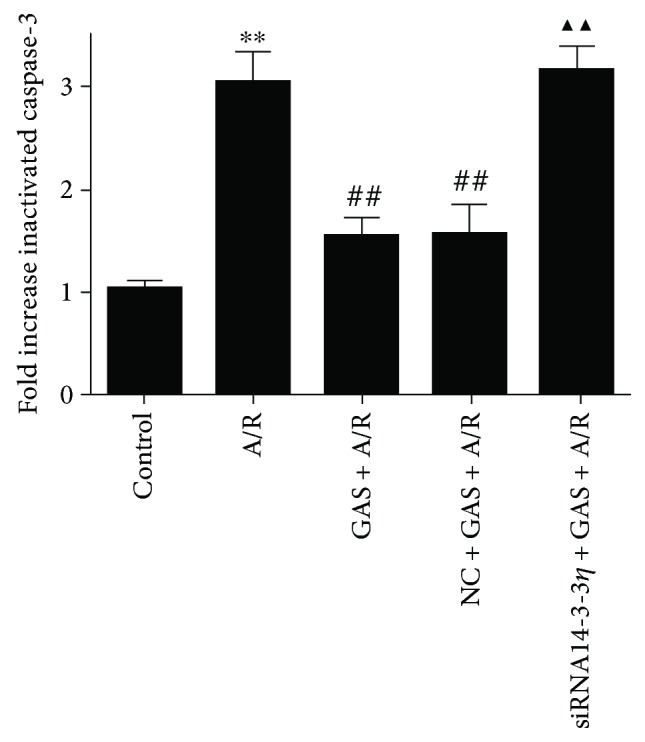
Figure 7.

Gastrodin (GAS) pretreatment influenced the activity of caspase-3 induced by A/R injury. The column bar graph shows the activity of caspase-3 in different groups. Data are shown as the mean ± SEM (n = 3). ∗∗P < 0.01 versus control group, ##P < 0.01 versus A/R group, and ▲▲P < 0.01 versus GAS + A/R group.
