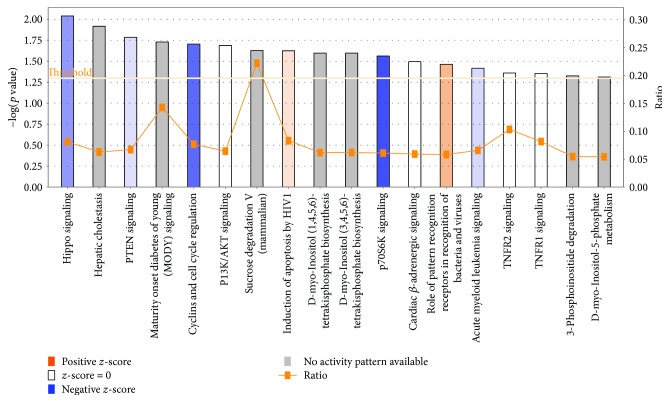
Figure 3.
Top canonical pathways altered by citalopram. This bar graph enlists the top canonical pathways predicted to be altered by citalopram treatment using ingenuity pathway core analysis. Citalopram treatment results in differential methylation of significant genes from our dataset that are enriched in canonical pathways, like Hippo signaling, PTEN signaling, maturity-onset diabetes of the young (MODY) signaling, and cyclins and cell cycle regulation signaling based on their z-score, ratio, and −log (p value). A positive z-score (orange) denotes activation of pathway (e.g., role of pattern recognition receptors in recognition of bacteria and viruses), and a negative z-score (blue) denotes inhibition of a pathway (e.g., P70S6K signaling). The ratio (orange line with blocks) represents a ratio of genes from our dataset that is enriched in the pathway divided by the total number of genes enriched in the same pathway according to current IPA database [e.g., 22.5% sucrose degradation V (mammalian)]. Threshold is set at the lowest level of confidence that is acceptable statistically (p < 0.05).

